By Dick Kazarian, Managing Director, Borrower Analytics Group
Each issue of our Quarterly Perspectives consists of articles that cover topics of interest to mortgage market participants. This article reviews the following topics:
• Mortgage Rates and Spreads
• Update on the PMMS Survey
• Prepayment changes from our MIMs Survey
• Housing Markets
30-Year Mortgage Rates and Spreads
Figure 1 displays quarter-end snapshots of primary (PMR) and secondary (CCY) 30-year Conventional mortgage rates from Q4 2020 through Q3 2022. Over the first three quarters of 2022, primary rates have doubled, from 3.30 to 6.58. Secondary rates have increased even more, from 2.09 to 5.71. As a result, the primary/secondary spread (PMR/CCY) narrowed by a significant 34 bps YTD.
The Constant Maturity Swap (CMS) curve experienced a significant bear flattener. The CMS-2Y backed up significantly more (358 bps) than the CMS-10Y (230 bps). The result was an inverted yield curve as of Q3 2022. The CCY/CMS-10Y spread also widened considerably over this period, from a tight of 53 bps on 12/31/21 to a wide of 185 bps on 9/30/22.
The speed and magnitude of these changes in rate levels and spreads is unprecedented in recent history. The implications have been felt across the residential mortgage landscape and beyond. Two natural questions include: what drives these spreads, and when might they return to something resembling normalcy?
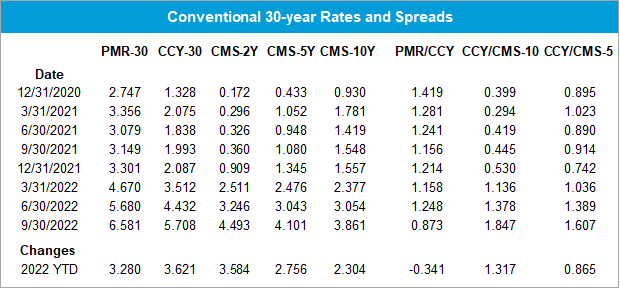
Figure 1: Conventional 30-year Rates and Spreads Source: FHLMC, MIAC Analytics™
We start with the dynamics of the PMR/CCY spread. This spread is driven by numerous factors, including g-fees, servicing and origination costs, along with numerous other minor factors. Aside from the g-fee, this spread can be considered the retail markup over the wholesale cost of mortgages (i.e., the secondary rate). Many of these factors change very slowly over time and only impact the long run level of the PMR/CCY spread. For example, technological changes (e.g., e-closings), policy shifts (e.g., appraisal waivers) and market forces (e.g., the entry of FinTech lenders) are expected to gradually lower origination costs over the next few years.
In contrast, the biggest driver of short run dynamics in the PMR/CCY spread is the ability of originators to exercise market power. When rates rally sharply, the demand for refinances increases. Since capacity is fixed in the short run, originators can and do adjust primary rates to ration excess demand. This results in a widening of the PMR/CCY spread, as well an increase in gain on sale margins. Additionally, the larger the newly refinanceable universe, the greater the originator pricing power. Over time, as the outstanding mortgage universe gets refinanced and capacity constraints abate, the spread will narrow to a level driven primarily by the long-run factors listed above.
This PMR/CCY spread compression is what we have been observing over the first three quarters of 2022. In fact, we believe (along with many other observers) that we are now close to the minimum spread needed for originators to make a normal economic profit. As a result, subsequent increases in CCY will have little impact on the PMR/CCY spread. In addition, decreases in the CCY rates will have a muted impact on the PMR/CCY spread. This is because the prior refinance waves have dramatically reduced the size of the prospective refinance universe, even if rates rally 150-200 bps from here. Taken together, we expect a very low and stable PMR/CCY spread going forward.
In sharp contrast to the PMR/CCY spread, we expect significant volatility in the secondary/swap (CCY/CMS) spread to continue over at least the next year, and perhaps beyond. We have already seen this play out in 2022, with CCY/CMS spread widening for most of this year. This sharply divergent behavior of these two spreads occurs because they are driven by an entirely different set of causal factors. The CCY/CMS spread is driven by implied volatility, the Fed’s activity (balance sheet and rate targeting), private sector demand for MBS (including CMO demand), the slope of the swap curve, generic refinance efficiency, and other factors. For example, implied volatility of 1Yx10Y European Swaptions has almost doubled YTD 2022. Longer-expiry implied volatility is generally lower than short-expiry volatility, which suggests that this period of heightened rate volatility is expected to subside at some point. Another big driver of CCY/CMS spread widening has been the Federal Reserve and lackluster demand from other investors (e.g., banks and money managers).
We close with several important points. First, increases in implied volatility will raise zero-volatility (ZV) spreads (and other static yield measures), but will not necessarily impact option-adjusted spreads (OAS). In contrast, reductions in demand, from whatever source, will increase both OASs and ZVs. Thus far in 2022, we have seen both at play.
A second point is that the disparate behavior in CCY/CMS and PMR/CCY spreads is a vital reminder of why naïve models which link PMR to CMS directly (thus ignoring the intervening behavior of CCY) are badly mis-specified and cannot be relied on to give accurate measures of value, risk sensitivities, or stress valuations.
Third, MIAC has transitioned from LIBOR-linked swaps to SOFR-linked swaps in our analytics and software. In subsequent issues of MIAC Perspectives, we will augment our charts to include both series.
15-Year Mortgage Rates and Spreads
The same patterns discussed above are also apparent in the 15-year Conventional market (Figure 2). And the same reasoning applies. The 15-year PMR/CCY is at or near its low, and we expect it to be even more stable than the 30-year PMR/CCY spread. This is because the 15-year market is primarily a refinance market, whereas the 30-year market is a blend of purchase and refinance originations. And, as noted above, it is the sudden excess demand in the refinance market that gives originators their pricing power; purchase activity is far too stable to produce much volatility. While 15-year originations may maintain their share of the refinance market, their share of total originations is expected to plummet along with the refinance share.
The complete time series of month-end rates and spreads since the start of 2021 is displayed in Figures 3-4.
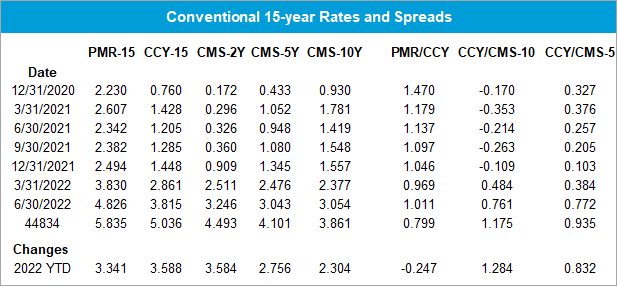
Figure 2: Conventional 15-year Rates and Spreads Source: FHLMC, MIAC Analytics™
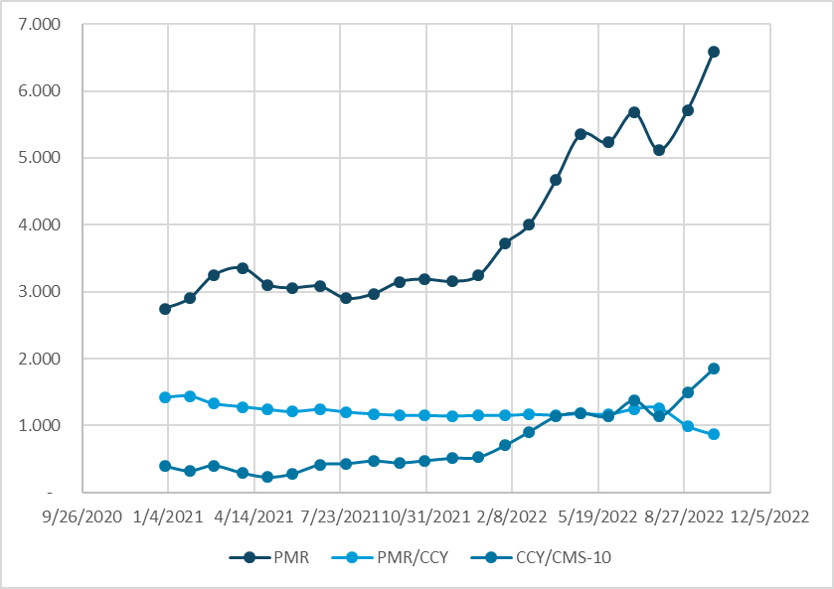
Figure 3: Conventional 30-year Rates and Spreads Source: FHLMC, MIAC Analytics™
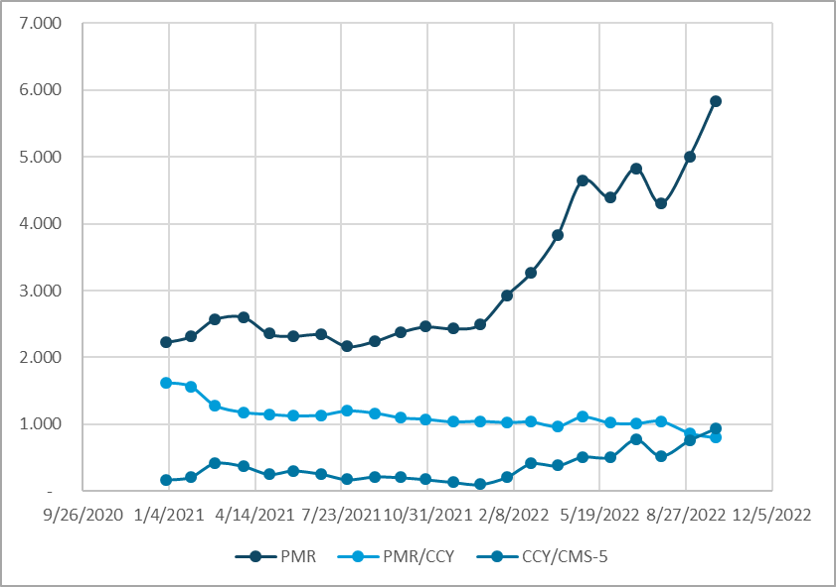
Figure 4: Conventional 15-year Rates and Spreads Source: FHLMC, MIAC Analytics™
Update on the PMMS Survey
To track and analyze rates and spreads, it is necessary to have high quality data on all three series: PMR, CCY, and CMS. For primary mortgage rates, we use the FHLMC PMMS survey rate, adjusted for the 3-day averaging implicit in their survey methodology. While we acknowledge the choice of primary rate series has become a topic of discussion, competing surveys that are not quality-adjusted can overstate volatility.
Also, FHLMC has announced that they will be changing their PMR methodology in November 2022. In fact, it will no longer be an originator survey per se. FHLMC will publish a white paper later this year, and we will provide commentary in our Winter Edition of MIAC Perspectives.
Secondary Mortgage Rates: Improved Market Transparency with MIAC Data Products
The computation of the secondary mortgage rate, CCY, involves two components. The first component is accurate TBA pricing. Although the TBA market is generally quite liquid for coupons close to parity and for the first couple of settlement months, careful processing of the TRACE data can result in improved price discovery relative to other TBA benchmarks. MIAC has developed an IOSCO-compliant Price Fixing Methodology, MIAC TBA Fixings™. Our analysis has found that this methodology provides more accurate end-of-day pricing than alternative approaches.
The second component of accurate secondary rate computation is the calculation method used to solve for the yield. This methodology is particularly relevant when the entire liquid TBA stack is at a premium or at a discount. Over the past few years, we have seen several instances where the entire TBA stack was at a premium and extrapolation was needed for the CCY100 calculation. As a result, some participants began quoting and tracking a CCY102 series. Given the rate sell-off, with much or most of the tradable stack at a discount, some participants who migrated to CCY102 are considering a move back to CCY100 where they can establish better pricing and TBA attribute discovery.
Whatever the CCY strike, our internal research shows that our MIAC CCY ™ series can differ from alternative vendors by as much as 5-7 bps. For more information on these and other MIAC Data Products, please contact your MIAC Account Representative.
Prepayment changes from our MIMs Survey
Our MIMs Prepayment Survey for key coupon aggregates over the past quarter is displayed in Figure 5. In this analysis, the underlying cohort attributes are held constant, and the changes reflect the impact of increases in the primary mortgage rate alone. These prepayments are median average life equivalent (ALE) prepayment speeds inclusive of buyouts and other pool-level exits. For each coupon aggregate, we calculate the median over all contributors for each cohort, and then calculate a UPB-weighted average to aggregate up across vintages to the product/coupon level.
Several themes are apparent from Figure 5. First, the PMR backup over the first three quarters of 2022, one of the largest quarterly backups observed over the past half-century, has resulted in a significant decline in forecasted prepayment speeds. Prepayment speeds on the 4.0 and 4.5 coupon aggregates have dropped by more than 50% since the end of 2021. Lower coupons have had a much more muted response, as they were already OTM at the end of 2021. Given the rate incentive of these lower coupons (between 1.5 and 3.0), the only source of prepayments is turnover and a small number of curtailments. And even these sources have been reduced by the lock-in effect. As further explained in the Spring 2022 issue of MIAC Perspectives, extension risk has replaced prepayment risk as a top concern for mortgage participants.
A second point to note in Figure 5 is the addition of higher coupon cohorts (with coupons from 4.0-6.0) and their aggregates in our MIMs survey. These cohorts did not exist at the beginning of 2022 when we created these cohorts. Their addition was necessitated by the previously noted sell-off.
A third observation is worth elaboration. In general, higher coupon aggregates have higher prepayments. But this is not always the case, and in fact is not logically required by a well-specified prepayment model. The most obvious reason for higher coupons having lower prepayments is the accumulation of refinance burnout, especially for the older vintages.
In Figure 5, we see that the CONV-2.5 aggregate has a lower average prepayment than the CONV-2.0 aggregate, and burnout is obviously not the reason. What is this attributed to? Within the CONV-2.5 aggregate, the 2019 vintage is the largest component. This vintage has a particularly large average balance. And for loans that are out-of-the-money (OTM) for refinancing, higher balance means slower prepays. In other words, the lock-in effect is more pronounced for higher balance loans. Stated another way, higher balance loans have uniformly worse convexity: they prepay faster as premiums and prepay slower as discounts. This is also evident in the Specified Pool market, where discount low loan balance (LLB) pools trade at a premium price vs. TBA, a consequence of their faster speeds.
A fourth and final observation is that the ATM and ITM GNMAs generally have higher prepays than their Conventional counterparts. This is due to a combination of 1) VA speeds being faster than Conventional speeds, 2) higher EBOs (mostly within FHA), 3) near-ATM FHA speeds being faster than Conventional due to FHA to Conventional refinancing, 4) slower prepayment burnout accumulation in the GNMA, and 5) very efficient streamlined refinance options in FHA/VA.
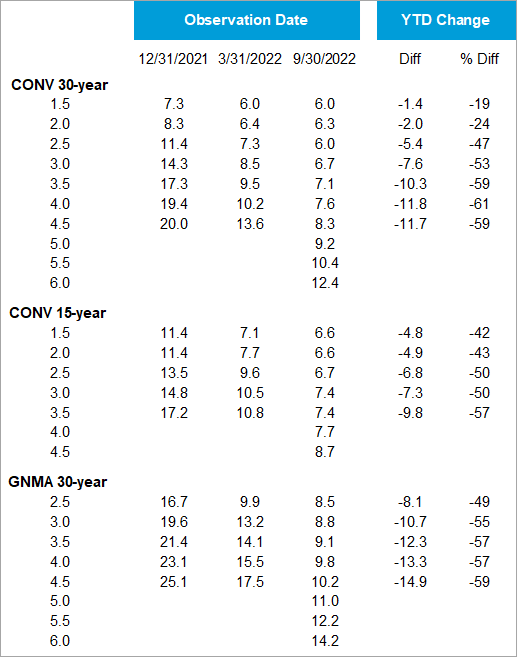
Figure 5: MIMs™ Prepayment Projections Source: MIAC Analytics™
Housing Markets: The tide is finally turning
Until the end of Q2 2022, residential home prices had been mostly rising since the end of the Great Financial Crisis (GFC). This applies to all geographical areas, all indices (e.g., FHFA, CoreLogic, AEI, Redfin, etc.), all price tiers, and all property types (Single Family, Condo, and Multi-Family). Starting in July, many of these indices turned negative, especially in higher priced metros on the west coast.
Many dealers have updated their national HPA forecasts to be negative, or at best flat, over the next few years. Those that forecast the regional or state level HPA predict much higher declines in coastal metros, especially higher-priced areas of the west coast.
These trends in rates and home prices have numerous implications for the mortgage market. Considering the significant amount of equity in seasoned vintages and unseasoned Agency and Non-Agency, the impact on credit should be minimal. This is in sharp contrast to the GFC where home prices dropped significantly, unemployment rose, and starting LTVs were higher. However, the impact of declining HPA is likely to be significant in the newly issued FHA sector, where both original and current LTVs are high. In contrast to the GFC, the ability of servicers to modify the rate of financially troubled borrowers will be significantly reduced because of the rate sell-off. We expect that this combination of negative equity and higher rates could spell trouble for GNMA servicers, and take a closer look at FHA Credit later in this issue.
Existing home sales (EHS) are a closely watched barometer of the housing market and have been declining for the past two years. The connection between EHS and discount prepayments is compromised by the existence of all-cash individual buyers, as well as institutional buyers (who represent 13% of transactions nationally). Still, EHS are monitored for insight on how significant lock-in may become, as well as the overall health of the housing market.
MIAC Perspectives: Market Overview
Author
Dick Kazarian, Managing Director, Borrower Analytics Group
Dick.Kazarian@miacanalytics.com
View MIAC Perspectives – Fall 2022 Issue