TBA Trading Volume
Trading volume was up quite a bit this week. At the same time, borrowers took advantage of the lowest rates since late 2017.
Conv 30yr trades led the way with a 37% increase week over week. With the move down in rates, we saw trade volume shift down in coupon. 83% of Conv 30yr trades were in the 3.0 – 4.0 coupons, with the bulk of it in the 3.5 coupon. GNMA 30yr trades still had the highest concentration in the 4 coupon, but the overall volume did shift lower to the 3.0 – 4.0 range like the Conv 30yr.
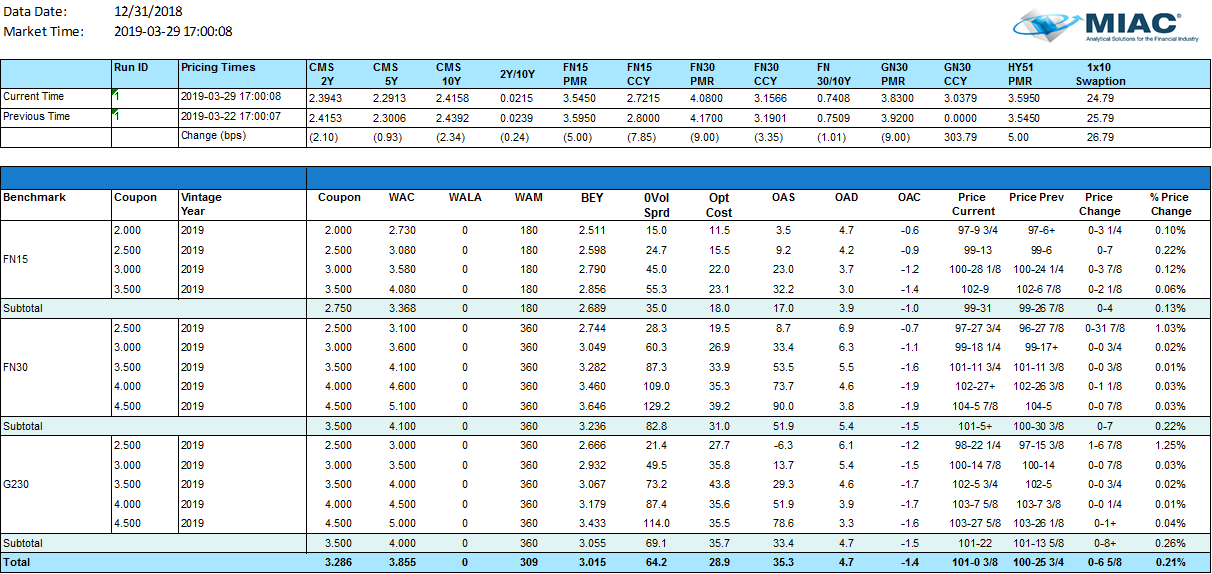
Figure 1: Period-Over-Period Price Change by Benchmark, Coupon and Vintage Year Source: MIAC Analytics™
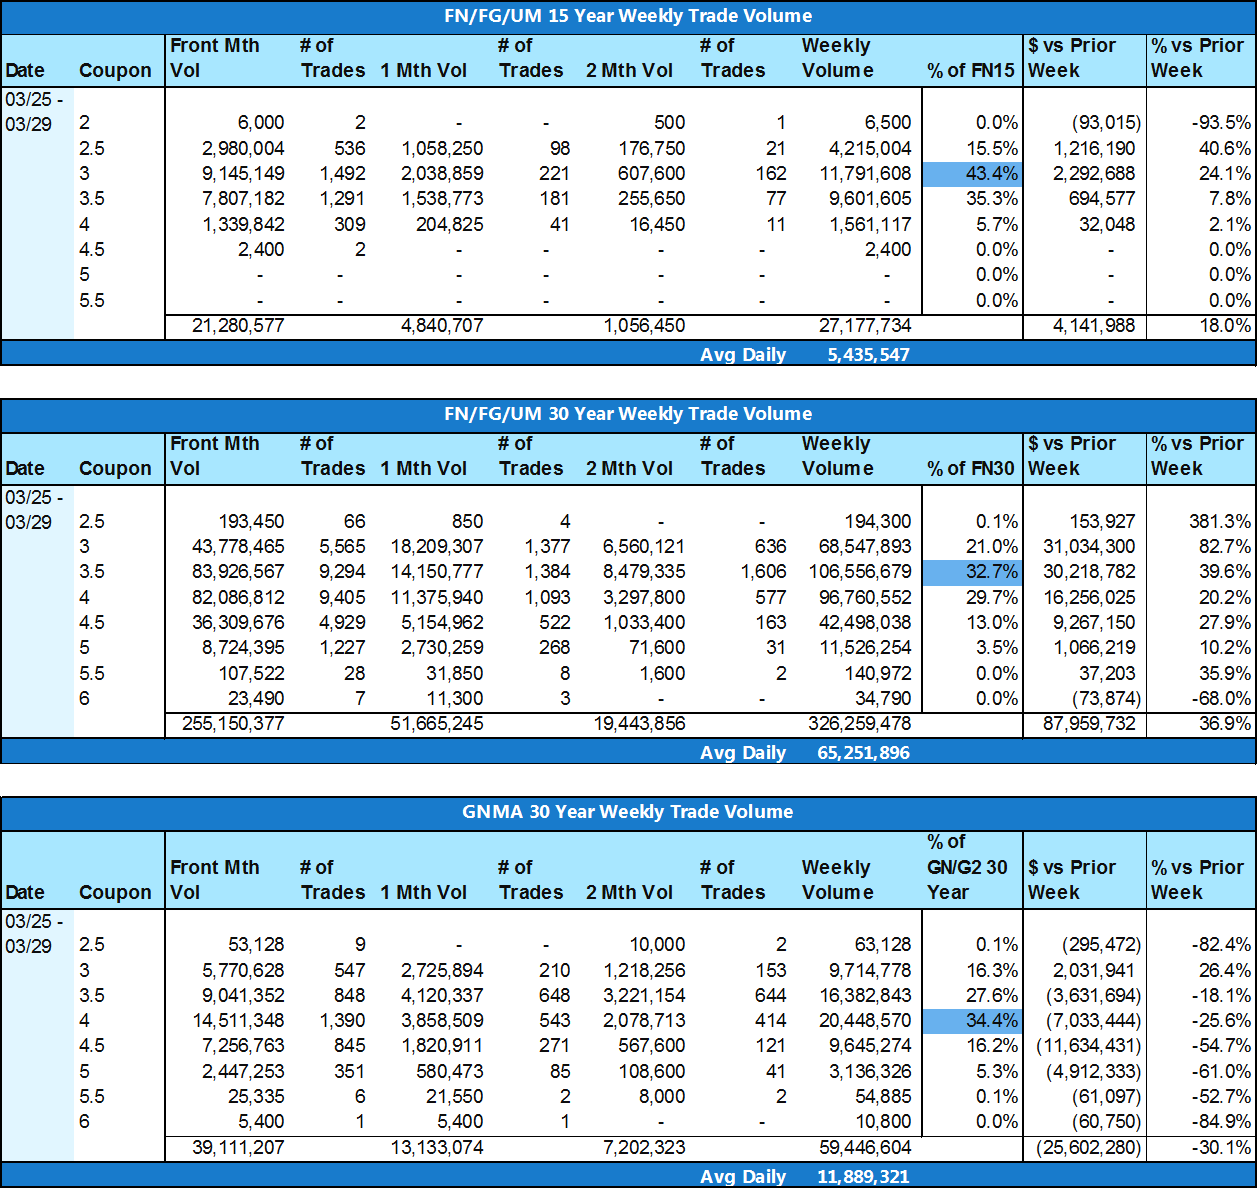
Figure 2: Weekly Trade Volume Source: MIAC Analytics™
The 2-10 spread widened last week to 14 while 10-Yr Treasuries finished lower at 2.405. FN 5’s outperformed GN 5’s as investors weigh the risks of faster prepay speeds and less liquidity with higher GN coupons. The rest of the coupon stack showed little variance between FN and GN week over week. We’ve seen spec pay ups across all coupon stacks improve over the past few weeks as investors are looking into different avenues to manage refinance risk. While it isn’t surprising that the low loan balance pools receive the highest pay-ups, we have noticed that New York spec pools have become more enticing as lower coupon NY spec pools tend to prepay slower.
Mortgage applications rose for the sixth time in seven weeks as purchase volume increased 6% WoW and refinance volume surged over 12%. Rates still have a way to go before we see any type of refinance boom as they are competing with the lower rates we saw in 2012 and 2016 (rates in the mid 3’s). With that said, Housing Starts came in well ahead of expectations on Friday so we are starting to head in the right direction. Data released from Freddie Mac on Thursday showed the average 30-Yr Fixed Rate now sits at 4.06%. Uncertainty around trade, Brexit, and global economic slowdown have investors fleeing to less risky investments such as Treasuries and mortgage rates are reaping the benefits. A big disappointment with jobs numbers on Friday could easily push yields lower to test 2.40.
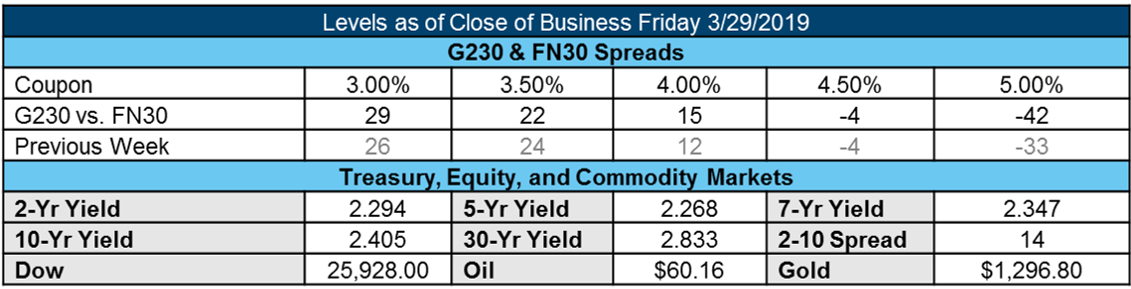
Figure 3: Market Level at Close of Business Source: MIAC Analytics™
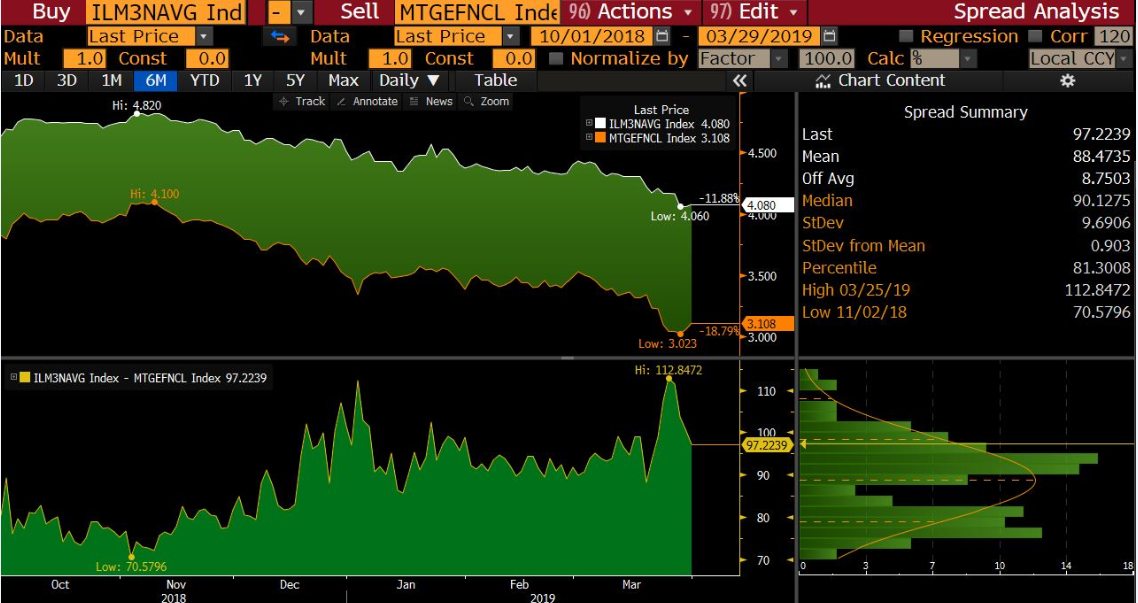
Figure 4: Primary/Secondary Spread Source: Bloomberg
Consumer Confidence
March Consumer Confidence declined to 124.1 from 131.4 in February. Consumer Confidence reached a post-recession peak in October at 137.9 and has been softening ever since, which some believe points to a moderation in economic growth. In March, the Present Conditions portion of the index fell by the most since 2008 as job outlook deteriorated. Declines were seen across the present situation component (160.6 from 172.8) and future expectations (99.8 to 103.8) leading to the lowest assessment since April 2018.
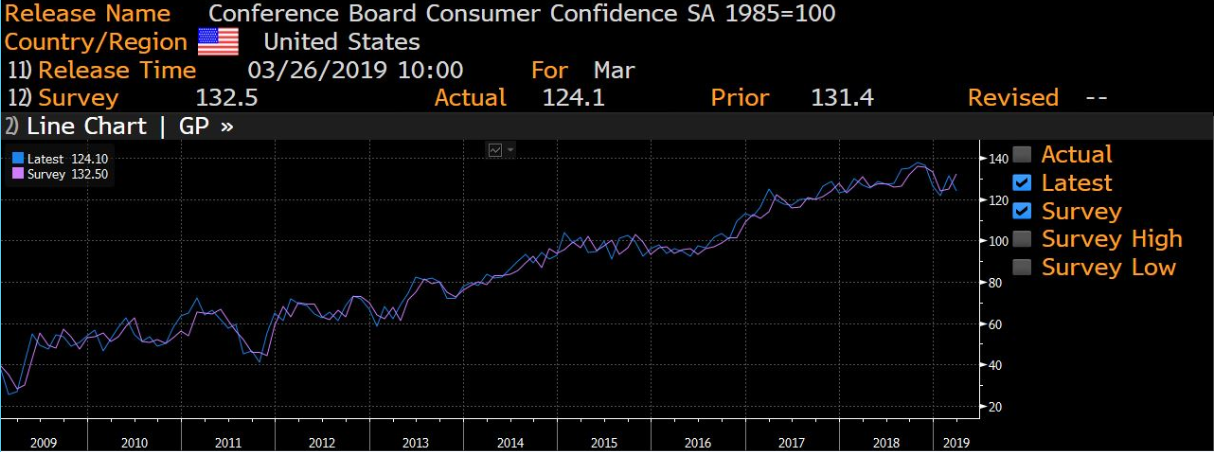
Figure 5: Consumer Confidence disappoints to the downside Source: Bloomberg
U.S. Inflation
On Friday, the price index for personal-consumption expenditures, a key measure of U.S. inflation fell to its slowest pace since January 2016 coming in at just +1.37%. Core PCE (removing volatile food and energy components) rose slightly to 1.79% for January (an 11-month low) vs. the forecast of 1.9%. The headline PCE deflator declined 0.1% while consensus called for a +0.2% improvement. Weakening inflation fueled by global economic uncertainty and trade war tensions continues to weigh heavily on the Fed and its rate policy moving forward.

Figure 6: Personal Consumption fell to slowest pace since January 2016 Source: Bloomberg
New Home Sales
New home sales for February came in at 667k vs expectations of 620k equating to a 4.9% MoM gain compared with 2.1% projected. January numbers were heavily revised upwards as New Home Sales Change MoM were revised upwards from -6.9 to +8.2 and MoM units were revised from 607k to 636k. Dropping mortgage rates are part of what is feeding home sales. On Thursday, Freddie Mac showed that the weekly average 30-Yr Fixed Mortgage Rate dropped from 4.28% to 4.06%. This is the largest one week drop in over 10-Yrs. Negative economic outlooks at home and abroad have been feeding the recent bond market rally.

Figure 7: New Home Sales beat expectations Source: Bloomberg
The Week Ahead
This week brings key economic data for the U.S. and abroad. Weary investors will be watching for signs of a global slowdown with the release of fourth-quarter domestic product readings from the U.S., U.K., and France. Weak eurozone and U.S. manufacturing data caused bond markets to rally at the end of last week and yields could drop even lower if this week’s data continues to show a global slowdown. Other notable data releases include Consumer Confidence, Jobless Claims, Chicago PMI, and Consumer Sentiment.
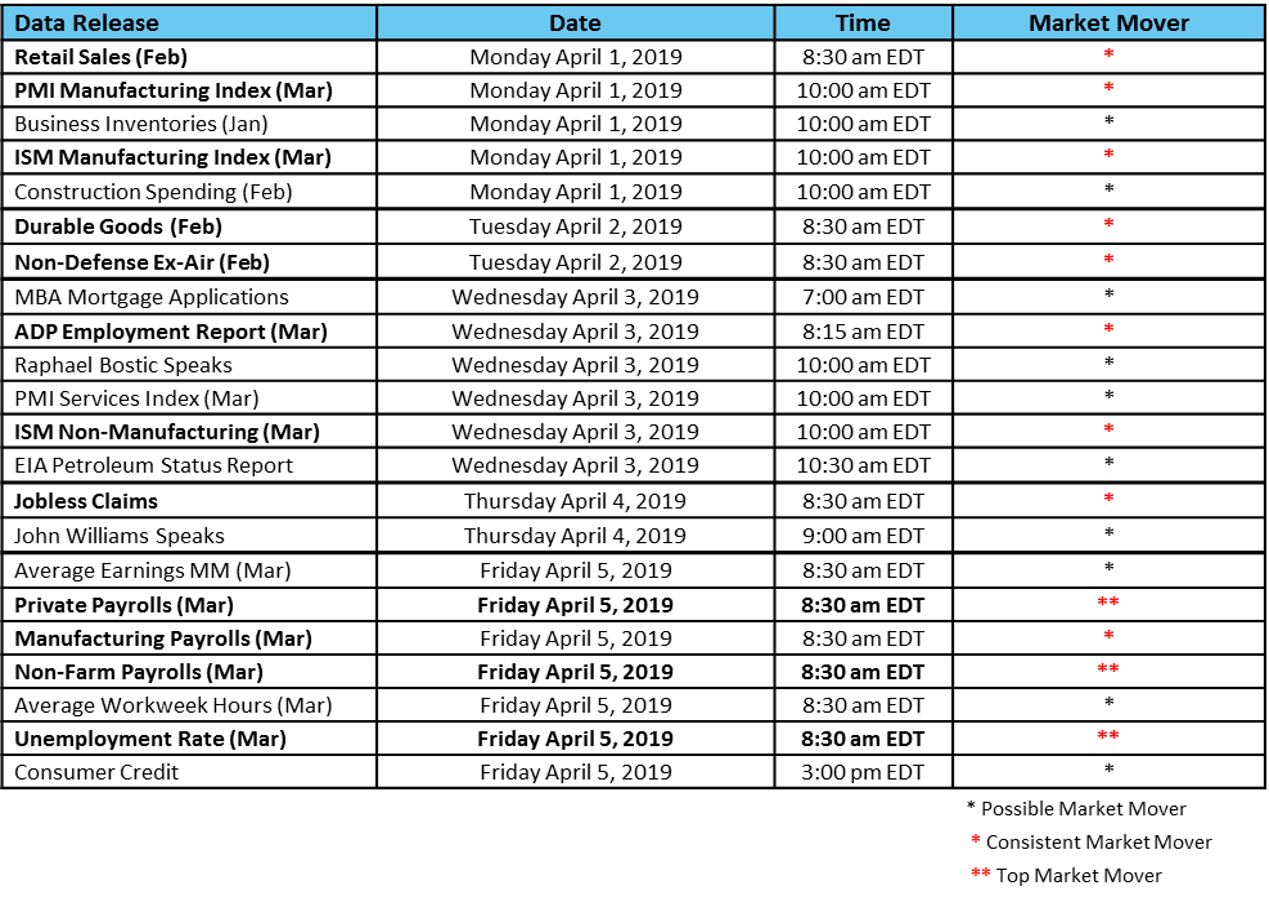
Figure 8: Weekly Data Releases Source: MIAC Analytics™
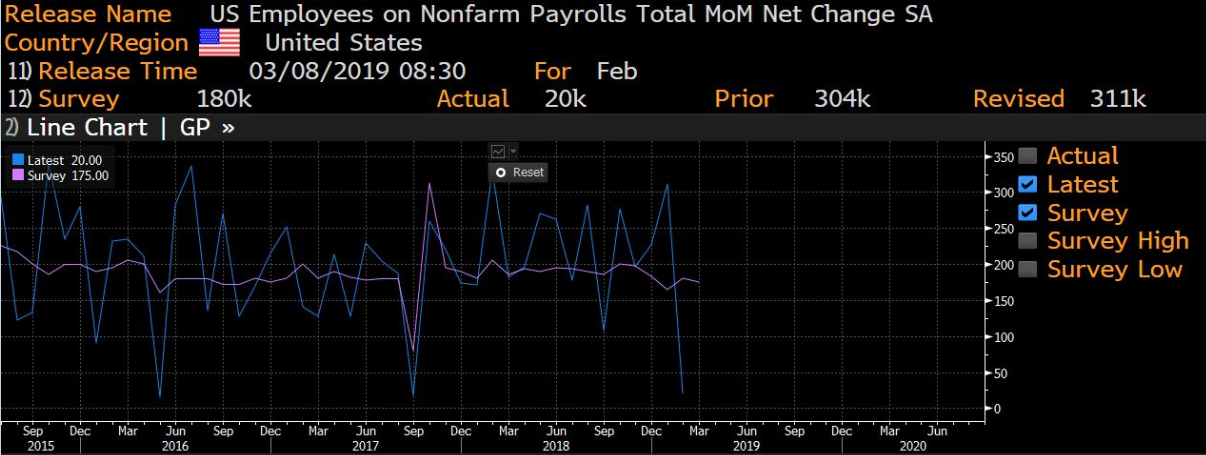
Figure 9: Non-Farm Payrolls Source: Bloomberg
.
.
Secondary Markets Commentary – Week of April 1, 2019
Author
Brad Eskridge, Managing Director, Secondary Solutions Group
Bradley.Eskridge@miacanalytics.com
Author
Justin Deaver, Account Manager, Secondary Solutions Group
Justin.Deaver@miacanalytics.com