By Brendan Teeley, Senior Vice President, Capital Markets Group
This article reviews recent developments and their impact on seasoned whole loan markets. MIAC regularly represents buyers and sellers across a broad range of market segments. In this article, we focus on the following: CRA, EBOs Fix-and-Flip, Puerto Rico, and Scratch and Dent.
CRA – Community Reinvestment Act
On Nov 1, 2021, New York State’s legislature and governor signed into law requirements that independent mortgage companies (hereafter, IMBs) are now subject to the same CRA provisions that regulate state and federally-charted banks. Broadening access to mortgage credit serves a public policy objective but might result in unintended negative consequences for low income borrowers. After Massachusetts passed a similar law in 2008, the number of IMBs in the state declined, thereby reducing borrower’s access to lenders.
In 2008, Massachusetts instituted CRA requirements for IMBs. At that time, Massachusetts IMBs were responsible for a greater percentage of mortgage originations than depositories, relative to a national average. By 2020, IMBs share of originations trailed depositories by 17%. Given that IMBs have a higher market share of the low to moderate income borrower base, we expect a reduction in IMB production that will adversely impact the intended beneficiaries.
According to the Urban Institute, IMBs make twice as many loans to low income borrowers as banks. Banks generally hold loans on a balance sheet and make decisions that best support their risk tolerance. Regulated banks face disproportionate penalties and reputational risks for minor operational miscues handling FHA and VA loans (such as violations of the False Claims Act). In contrast, IMBs generally do not hold the mortgage and are more likely to outsource the borrower performance risk to taxpayers via HUD, Fannie and Freddie. IMBs are generally responsible for upwards of 90% of FHA lending, which is a leading source for mortgage financing for low to moderate income borrowers.
However well-intentioned New York’s new law may be, history has shown that increased regulation and compliance costs will reduce credit availability and raise the ultimate cost to the borrower.
Overall, CRA activity was muted in 2021 as a result of the significant originations, both purchase and especially refinance. In fact, many depositories had excess CRA originations. If originations decline in 2022 and beyond, as we expect they will, CRA trading activity will increase.
MIAC has one of the largest originator client bases in the industry and can help financial institutions subject to CRA to source loans in their designated CRA geographic regions.
EBOs (Early Buy Outs)
According to HUD Press Release No. 21-160, forbearance agreements may be extended out as far as October 2022 in certain circumstances. The structure of these forbearances is intended to help transition borrowers into repayment. HUD Secretary Fudge has been particularly vocal about prioritizing home retention over alternative resolutions. However, data from the MBA points to the fact that the longer borrowers stay in forbearance, the less likely they are to ever become current through a self-cure. According to Michael Fratantoni, Chief Economist at the Mortgage Bankers Association, “Borrowers who are exiting forbearance now are likely to have been in relief for over a year, with almost 60% of borrowers in forbearance extensions of longer than 12 months. These borrowers may face more challenges getting back to making regular payments.” And according to JP Morgan Research, monthly cure rates for GNMA loans that are 18+ months delinquent are in the neighborhood of 5%, compared to over 40% for Conventional loans1.
Similar to other asset classes, the EBO performance projections are highly sensitive to the COVID pandemic, government policy, employment and income as it impacts borrowers’ ability to pay. In addition, EBO performance is highly dependent upon HPA, which has shown explosive growth over the past few years. If borrowers have trouble making payments but have positive equity, they can sell their home and retain the equity they have accumulated. Mark-to-market LTV (LTV-MTM) is a critical driver of liquidations, prepayments, and loss severities in all MIAC CORE™ models.
In order to address the significant importance of EBOs, MIAC has developed a monthly EBO report. The report contains data extracted from the eMBS database for GNMA pools. Figure 1 shows an extract of the full report as of December 2021. The entire GNMA population consisted of 10.8M loans with $1.6T balance outstanding. At the start of December, the D60+ population was 383,000 loans with a $69B UPB, about 4.3% of the total. D60 loans that did not make their subsequent payment would be eligible for buyouts. Not surprisingly, the D60+ population had a significantly higher WAC than the overall population. Realized December buyouts totaled $2.9B, about 4.2% of the prior month’s D60+ population. This report clearly shows that servicers are prioritizing the highest WAC loans for buyouts.
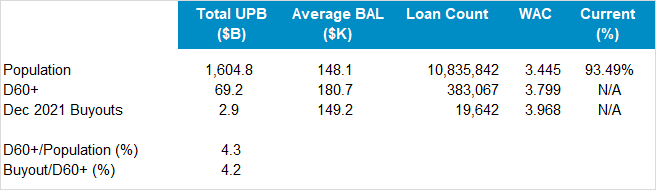
Figure 1: Outstanding attributes and realized buyouts (GNMA) Source: eMBS, MIAC Analytics™
MIAC’s Whole Loan Trading Desk is very active in the EBO market. In Q4 2021, we executed more than $1B UPB of GNMA EBOs for numerous sellers (both depositories, as well as non-bank originators). These sales allow owners and servicers to capture the economic benefits of buyouts without the performance uncertainty, balance sheet utilization, and need for hedging the duration exposure. Further, sellers avoid the significant operational complexity of servicing and re-delivering these assets.
Typical transactions range from $25 – $400M total UPB. Execution levels are driven primarily by geography, pre-COVID pay history, mark-to-market LTV, and the FHA/VA mix. VA EBOs generally trade 3-4 points back of FHA EBOs due to the risk of no-bids. The impact of WAC on price should be positive, but 2021 trades have exhibited a fairly narrow WAC range. As a result, there is little direct empirical evidence for the WAC/pricing relationship.
Fix-and-Flip (Bridge) Loans
As the rate/term refinance market contracts with the increase in mortgage rates, the industry will cycle towards other products that facilitate balance sheet growth and serve new groups of borrowers. One of these markets that has always existed, in one form or another, is the Bridge loan market. These loans generally have smaller balances, have 6- to 18-month terms, are non-amortizing, and are made to non-owner occupants. Typically, the properties are vacant. Many Bridge loans are structured with funding for repairs. The robust housing market witnessed over the past several years drives up property values and also increases demand for rental properties, creating an economic environment that support high cap ex in the rental market. The origination market has grown organically, from family offices to regional mortgage originators, and now to larger originators/securitizers. The largest issuers are expecting to close $2B a year, with the 2022 US total likely to exceed $10B. It is estimated that there is as much as $75B of real estate that will be financed via these loans over the next two years.
The high coupon rate of these loans (typically 6-10%) give them an attractive risk weighted return. The typical bulk sale centers around $10M UPB or greater, as originators have less liquidity available to them than the buyers in the market. The greater yields allow for smaller transactions to retain attractive returns while building long term relationships.
MIAC works with several originators in various geographies to identify opportunities for both buyers and seller originators. Seller originators have the opportunity to book significant gain-on-sale (hereafter, GOS) margins for this asset class, while buyers can lock in a significantly favorable risk reward profile. On the buy-side, there has been a great deal of capital shift toward this space in the search for yield, given the lack of consistent growth in the Non-QM market.
Puerto Rican Loans
On January 18, 2022 a federal judge in Miami allowed Puerto Rico to exit its multi-year bankruptcy program. The $33B debt reduction resets to $7.4B of municipal debt, subject to successful payout for bond holders. This news, combined with the unique tax opportunities available, has further increased optimism for the island’s future.
Residential mortgage performance in PR is very distinct from mainland performance across all sectors: FHA, VA, Conventional, and Non-Agency. In general, PR prepayments are vastly slower (for both housing turnover and refinance). Also, delinquency transitions are worse, cure rates are higher, and liquidation timelines are much longer. These relationships hold even after adjusting for borrower, loan, and property attributes. MIAC’s CORE model handles these unique features with PR-specific coefficients and PR-specific sub-models. For portfolios with a significant fraction of PR loans, this level of granularity is critical for accurate valuation, risk sensitivities, and stress testing.
As one important example, the foreclosure timelines for PR mortgages are extremely long. In fact, PR mortgages are even longer than the mainland “Slow Judicial” liquidation timeline group average (which includes NY, NJ, ME, and VT). For more details regarding MIAC’s unique approach to granular loan-specific liquidation timelines, see our recent CORE Webinar.
In addition, the likelihood of ever completing a foreclosure is also very low, largely due to the court system, but also the seasonality of income and employment. Being an island with tourism as one the primary economies, COVID has had a particularly strong impact on employment. The strict quarantine regulations early in COVID ended up protecting the population and allowing the island to become more open to tourism as soon as vaccines were available.
Mortgage production in PR continues to be robust, with the largest percentage growth in the Jumbo space as the mainland population moves to the island, bringing with them employment, capital and entrepreneurship. The improving economy has dramatically reduced the non-performing and sub-performing population on the island, and the comparatively high yields have attracted mainland capital. Although there has been considerable bank consolidation over the past year, several non-banks have been building origination platforms and will be active in the years ahead.
All of these factors have moderately increased pricing as demand outstrips supply. Along with the increase in activity, there is greater transparency in the market and MIAC customers have been the beneficiaries in all areas (analytics, advisory, brokerage and valuation). Educated buyers are better able to understand the market and appreciate the unique features of PR loans, and this has benefited our sellers.
Scratch and Dent
The Scratch and Dent market has continued to be an important tool for non-bank originators, and others in the space with limited balance sheet capacity. Sellers can eliminate both credit and interest rate risk by selling loans that would otherwise adversely affect their warehouse lines or balance sheets.
The increase in the population of active buyers, even for smaller transactions, has improved pricing, pushing yields to all-time lows. Given the volume of profit and production in the past couple years, many originators are taking this opportunity to “off risk” these loans to counterparties better positioned to cure the defects, hedge the interim risk, and optimize the final execution.
The recent backup in mortgage rates has reduced the opportunity of using a refinance to cure defects. This will further increase the preference of many originators to sell rather than attempt to cure the defect(s) themselves.
MIAC’s Whole Loan Trading Desk is very active in the Scratch and Dent space, usually executing at least one each week. Our seller clients free up and redeploy capital, improve the overall credit profile of their remaining balance sheet, and avoid the operational headaches of curing the assets internally.
The typical transaction averages $1-5M UPB, depending on the size of the originator and their aggregator relationship(s). As a key value-add, MIAC understands and classifies the defect or reason the loans are not deliverable and matches these loans to buyers who have the most favorable outlook on that type of defect. We work to minimize any friction in a sale, and by understanding the economics of each buyer, our sellers are able to optimize their execution.
1Source: JPM securitized Products Weekly, 12 Nov 2021, p. 12 and Exhibit 11
MIAC Perspectives: Whole Loan Market Update – Q4 2021
Author
Brendan Teeley, Managing Director, MSR Valuations Group
Brendan.Teeley@miacanalytics.com