CORE™

Behavioral Models

CORE™ behavioral models forecast the frequency, timing, and severity of losses and voluntary prepayments conditional on macroeconomic scenarios. Scenarios can be differentiated by mortgage rates, home prices, and unemployment.
Request a free demo

Credit Frequency Models

We employ an exhaustive set of borrower, loan, property, and macroeconomic factors, utilizing over 30 attributes.

Asset Type Coverage

  • Agency (Agency-Securitized and Agency-Eligible)
  • Non-Agency (Jumbo, Non-QM, Legacy)
  • Government-Insured (FHA, VA, and RHS)

Explanatory Factors

  • Co-Borrower, DTI, Doc, FICO, Occupancy, Purpose
  • HPA, Unemployment change
  • Age, Lien Position, Time-in-State, Modifications
  • DSCR, Full Document and Bank Statement

Additional Features

CORE™ model projections incorporate both home prices and unemployment change. We track detailed loan status from Current through REO, including time spent in each state. Granular sub-models capture distinct behavior within sectors and products, supporting predictive delinquency and foreclosure forecasts.

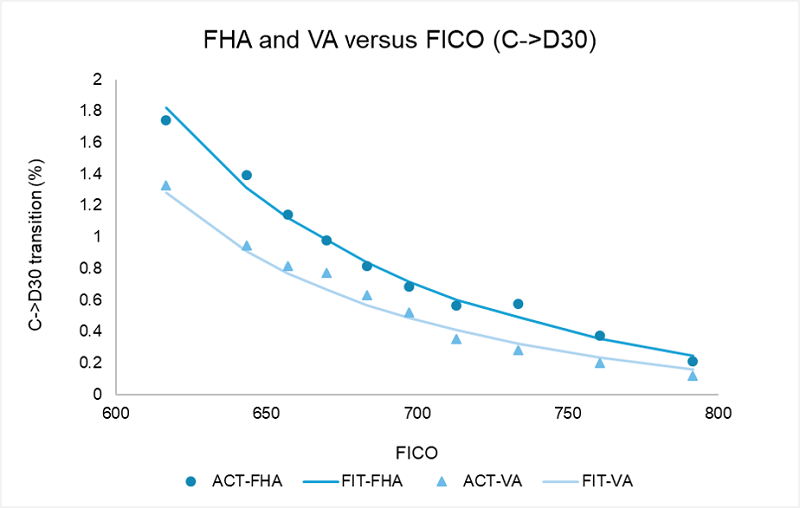
  • Within GNMA: FHA loans have worse credit than VA after adjusting for attributes
  • Within Non-QM: DSCR, Bank Statement and Full Doc
  • Probability-of-sale (POS) and judicial foreclosure (FCL) timelines

This statistical framework allows for complex and non-linear behavioral responses, to support the handling of competing risks.

Loss Severity Model

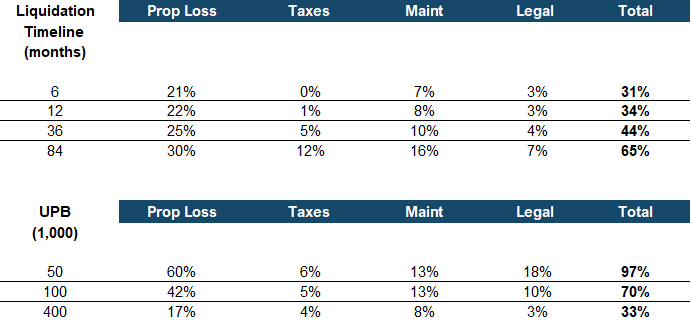
Our Loss Severity Model is driven by a large set of explanatory factors including State, Property Value, UPB, Foreclosure Type, Occupancy, Purpose, Channel, and Observation Date.

We project total loss severity as well as all four major relevant components, including:

  • Property Loss
  • Taxes and Insurance
  • Maintenance
  • Legal

The Loss Severity Model is fully integrated with the Credit Frequency Model. Liquidation timelines are produced by the Credit Frequency Model and input into the Severity Model. This integration enables users to perform “what if” exercises. Our estimation data includes more than 275,000 actual liquidations over the 2000-2017 period.

Term Structure Models

MIAC’s specification and implementation of the BGM Model has the following important features:

The forward curve is driven by three independent Brownian Motions which capture the full dynamics of yield curve movements. In particular, this allows for non-parallel yield curve shifts, which can be important for accurate duration estimates for Hybrids and mortgage derivatives, such as IOs.

Each volatility function is specified as the product of four components: a time-homogeneous horizon-dependent component, a rate level component, a calendar-dependent component, and a Monte-Carlo calibration component.

The volatility function, which describes the relationship between basis point volatility and the level of forward rates, is specified as a Displaced Diffusion Model. This specification is highly flexible and allows for a wide variety of model volatility skews. Lognormal and Normal models are special cases. Although lognormal and normal models are easier to implement and calibrate, evidence from both historical yield curve movements and observed volatility skews indicates that a more sophisticated approach is needed.

The production model is calibrated to a standard set of European Swaptions and Caps on a daily basis. Users can customize this calibration set if desired. Calibration reports are available.

Model Validation