Beginning with this issue, we are adding a “Research Insights” series to our Monthly Residential MSR Update. These Insights are designed to be both short and topical. Your feedback is essential to accomplishing these twin objectives. We welcome comments on existing articles as well as suggestions for future ones. The additional content will follow the MSR Market Update below.
Month-over-Month
From end-of-month September to end-of-month October the MIAC Generic Servicing Assets, (GSAs™) Conv_30 Index increased by 0.90% and the GNII_FHA_30 index increased by 4.73%. In larger GSA cohorts that are actively traded in the MSR market, the Conv30_3.5_2017 cohort increased by 1.06% and the GNII_FHA30_3.5_2017 cohort increased by 4.51%. During the month of October Conv_30 Index OAS’s tightened to close the month at 818.6 bps for a decrease of 21.8 bps. Likewise, GNII_FHA_30 Index OAS’s tightened to 953.0 bps for a month-over-month decrease of 78.1 bps. From September to October MIAC’s Primary Mortgage Rate increased by (5) basis points to 3.77%. The increase was further supported by three consecutive weeks of rising 30-year mortgage rates as reported by Freddie Mac.
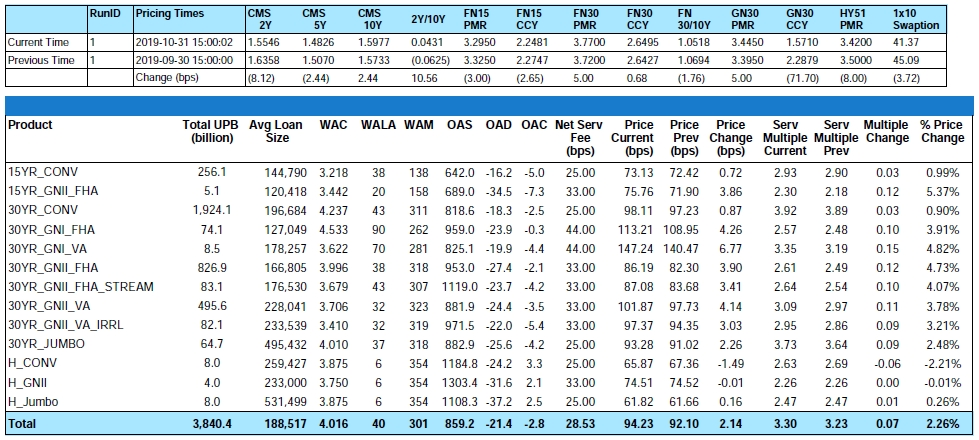
Figure 1: Month-over-Month Pricing Change by Product Source: MIAC Analytics™
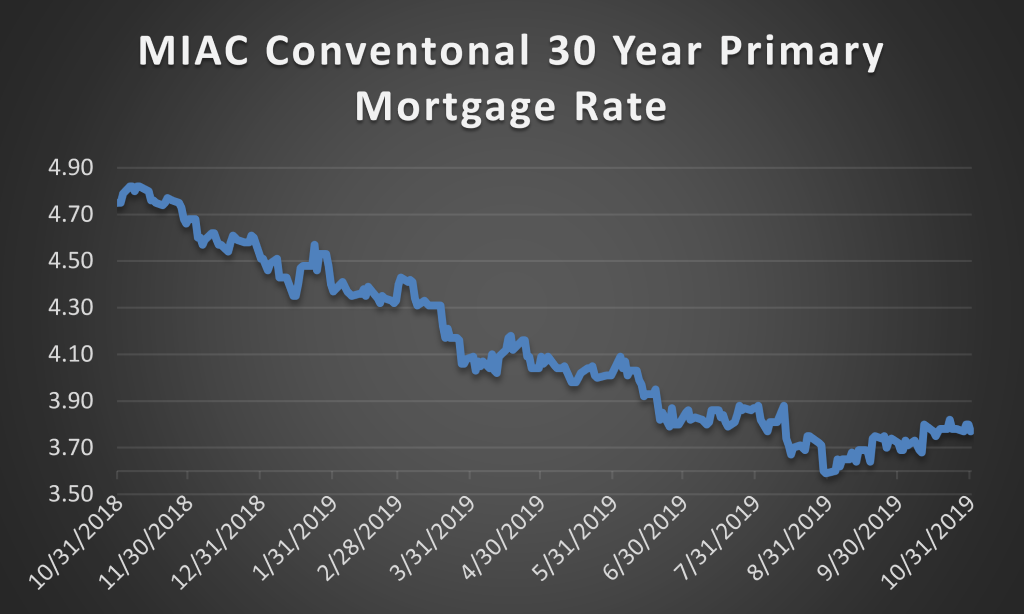
The fact that mortgage rates rose again illustrates how Federal Reserve policies can have somewhat of a limited “short term” effect on the mortgage market. This comes after the FED cut rates for a 3rd consecutive month to a current target of 1.50% to 1.75%. Despite the back-up in rates, 30-year rates remained relatively close to levels last seen in November of 2016 and slightly over 100 basis points lower compared to this time last year.
While lower rates this year have been overall detrimental to MSR values, origination volumes seem to suggest that better years lie ahead. In combination with a housing market that is expected to remain strong in the near future even as the U.S. faces a likely economic downturn, Freddie Mac is now forecasting back-to-back years of $2 trillion in mortgage loan originations rather than the previously forecasted drop-off in 2020. While slightly at odds with the MBA forecast of $1.89 trillion for 2020 and Fannie Mae’s forecast of $1.86 trillion, it still represents an increase over prior period projections.
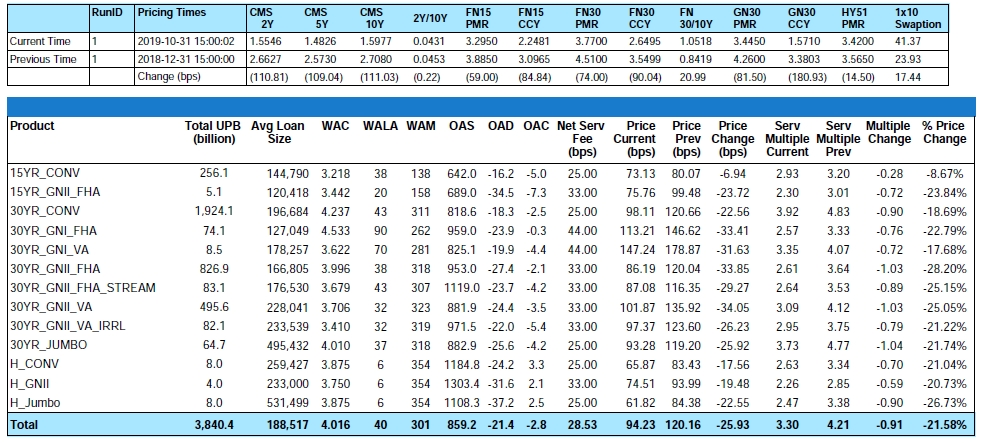
Figure 2: Year-to-Date Pricing Change by Product Source: MIAC Analytics™
Default Update
In a report first published by Black Knight, mortgage defaults within 6 months of close are on the rise. Overall 1% of loans originated in the 1st quarter of 2019 were delinquent within 6 months of origination. Among Ginnie Mae loans, 3.3% of the loans were delinquent six months after origination. While performance among repeat purchasers with Ginnie Mae loans remained relatively steady, mortgages made to first-time homebuyers by conforming and government lenders increased approximately 50% between 2014 and 2018. As homes become less affordable, particularly for first time homebuyers, debt-to-income ratios are on the rise. Since first time homebuyers made up 70% of the Ginnie Mae purchase market versus slightly over 40% of the conforming market it should come as no surprise that delinquencies among first time homeowners are on the rise “as well as” the need to properly forecast the resulting default risk.
Prepayment News
Partly due to a two business day increase in day count vs. September, month-over-month Agency MBS prepayments for October increased by 10% with 30-year conventional mortgages prepaying at a 21% CPR. 2018 vintage MSRs continue to prepay faster than older vintages with 4% coupon 2018 pools prepaying at a 41% CPR vs. 28% and 22% respectively for 2017 and 2016 vintage cohorts. Considering the seasonal impact and the three business day decline in November day count, Goldman Sachs is currently projecting a 15% month-over-month decline in CPRs.
Cash Crunch in the Mortgage Market?
While I would argue that there are numerous nonbanks that are as well if not better capitalized than many banks, financial regulators are once again raising a concern about the risk of an economically damaging cash crunch in the $10 trillion-plus home mortgage market. The concern centers around financially fragile firms and their dependency on short-term bank credit lines that could be pulled should market conditions worsen. If you recall, this issue was raised in a 2018 paper titled ‘Liquidity Crises in the Mortgage Market’ which focused on the rapid growth of the nonbank mortgage origination and servicing market and the potential related risks. Nonbanks currently service close to 50% of the loans supported by Ginnie Mae, Fannie Mae, and Freddie Mac. Furthermore, according to National Mortgage News, nonbanks currently originate around 70% of agency-supported residential home mortgages and about 90% of the loans backed by Ginnie Mae.
The concern among regulators is that many nonbanks are dependent on a single business line to make money and that they are not regulated by the Fed or the FDIC. Additionally, regulators are quick to point out that many nonbanks depend on credit lines to not only fund the mortgage until it is sold but also to cover their advance requirements when borrowers fall behind on their payments. Since credit lines are subject to cancellation or revision if the mortgage companies violate any of the terms or provisions of their contract, which often include a profitability requirement, short-term debt can be pulled at the moment that it is needed the most.
Michael Fratantoni, chief economist of the MBA played down the danger of a systemic liquidity squeeze by saying the chance of thousands of mortgage lenders being hit equally by the same financial shock as “very small” but with efforts underway, such as Ginnie Mae tightening its liquidity and capital requirements for the financiers it deals with, it seems this concern is not going away anytime soon.
MSR Transaction Activity
For anyone holding onto the belief that falling rates in 2019 crushed the amount of MSR transaction activity, think again. Through the first 3 quarters of 2019 over $450 billion in Bulk and Mergers and Acquisitions related transfers have occurred. Factor in Co-Issue and that number rises to nearly $600 billion. While sellers that do not have to sell are reluctant to sell during a rate trough, it is the immediate transition from higher rates to lower rates that can temporarily impact the volume of MSR transactions. Said another way (minus the impact of changes to economic assumptions) a 4.50% Conventional 30-Year MSR in a 4.50% Primary Mortgage Rate market is roughly equal in value to a 3.50% Conventional 30-Year MSR in a 3.50% Primary Mortgage Rate market. Assuming full year industry wide mortgage originations at or near $2 trillion and the increasing saturation of lower note rate MSRs on many portfolios, do not underestimate potential liquidity and resulting execution levels.
“Large” transactions which we define as deals containing $1 to $5 plus billion in unpaid principal balance continue to validate our very granular GSA prices. As for smaller offerings, the price/multiple spread initially tightened but depending on the trade and amount of buy-side interest is now showing some signs of widening. This is largely due to differences in the amount of recapture benefit being included into a buyers offering price. One issue with incorporating recapture into a GAAP value is that it is not unique to the contract but where it gets difficult is “many” buyers have virtually perfected the art of low cost recapture. If your firm is on the fence about recapture as part of a GAAP value, keep this in mind. Guidance tells us that that if deals are proven to reliably trade with a value attributable to recapture then it is possible to include. We have witnessed trades where the value attributed to recapture is zero basis points and others when the spread has been 12 basis points (and a lot in between). This has been an ongoing discussion with the SEC, OCC, FASB and others as they don’t want to say no in case liquid markets evolve to the point of incorporating such a value but they are skeptical about scoping in self-generated intangibles. If they trade and get compensated it can have support in GAAP. If it is just showing that they do it on their own and cannot demonstrate market pricing for it, GAAP typically doesn’t support it.
The smallest packages categorized as $300 million or less in unpaid principal balance are trading but at prices that “on average” range anywhere from 10 to 20 bps lower than the bid prices obtained on larger offerings. In addition to the reduced economies of scale afforded by larger MSR trades, the acquisition cost is one of the reasons that smaller deals can trade at a discount to larger offerings. The legal and due diligence cost that a buyer typically incurs to acquire a portfolio can influence how a firm might bid on a smaller trade. Even so, it is the smaller trades that can often create the largest margins and in a quest for margin, increasingly we see larger buyers bidding on smaller offerings but usually with a more rigid approach to price and term negotiations.
Regardless of size, not all bids are as they might appear on the surface. Differences in prepay protection periods, non-reimbursable advances, non-payment for assets that are 60 or more days delinquent, fee deducts for seriously delinquent MSRs, loan kicks, seller non-solicitation requirements, and possible set-up fees are just a few of the pitfalls that can quickly affect a seller’s net execution price.

Figure 3: Year-to-Date Conv 30-YR 3.50% 2019 GSA Index Source: MIAC Analytics™
MIAC’s MSR Valuation department provides MSR valuation advisory services to over 200 institutions totaling nearly $2 trillion in residential and commercial MSR valuations every month.
.
Residential MSR Market Update – October 2019
Author
Mike Carnes, Managing Director, MSR Valuations, Capital Markets Group
Mike.Carnes@miacanalytics.com
Research Insights: Credit Risk in GNMAs – October 2019
Measuring Credit Outcomes
There are numerous ways to quantify credit outcomes – each of these metrics have their strengths and weaknesses. However, for purposes of valuation, risk management, and scenario analysis, it is essential to estimate credit transitions. These are also commonly referred to as roll rates, and we use the terms synonymously. Transition rates are defined by the “from” status and the “to” status. For example, the fraction of loans that end up as 30-day delinquent (hereafter, D30) at the end of a given month relative to the number of loans that were current at the start of the month is referred to as the “current to D30” monthly transition. We’ll use the following notation “C->D30” to refer to these transition rates – which can be either historical realizations or model-based probabilities. In this setting, the fundamental unit of analysis is a loan/month, rather than a loan. This transition approach is equally applicable to both MSRs MSRs (where the primary concern is delinquencies and the need to advance; loss severities are secondary) as well as to whole loan valuation (where the primary concerns are cumulative liquidations and loss severities). In a forthcoming Research Insight, we’ll explain the reasoning behind this assertion, describe how these transition rates are integrated into our analytics platforms, and show how clients can access and dial them.
Figure 1 shows the C->D30 rate by sector across observation periods. These data points are from the GNMA MBS Loan Level Disclosures and go back to 2013. This figure shows that FHA C->D30 rates are substantially higher (roughly 1.8x) than VA C->D30 rates, and this holds across all observation periods.
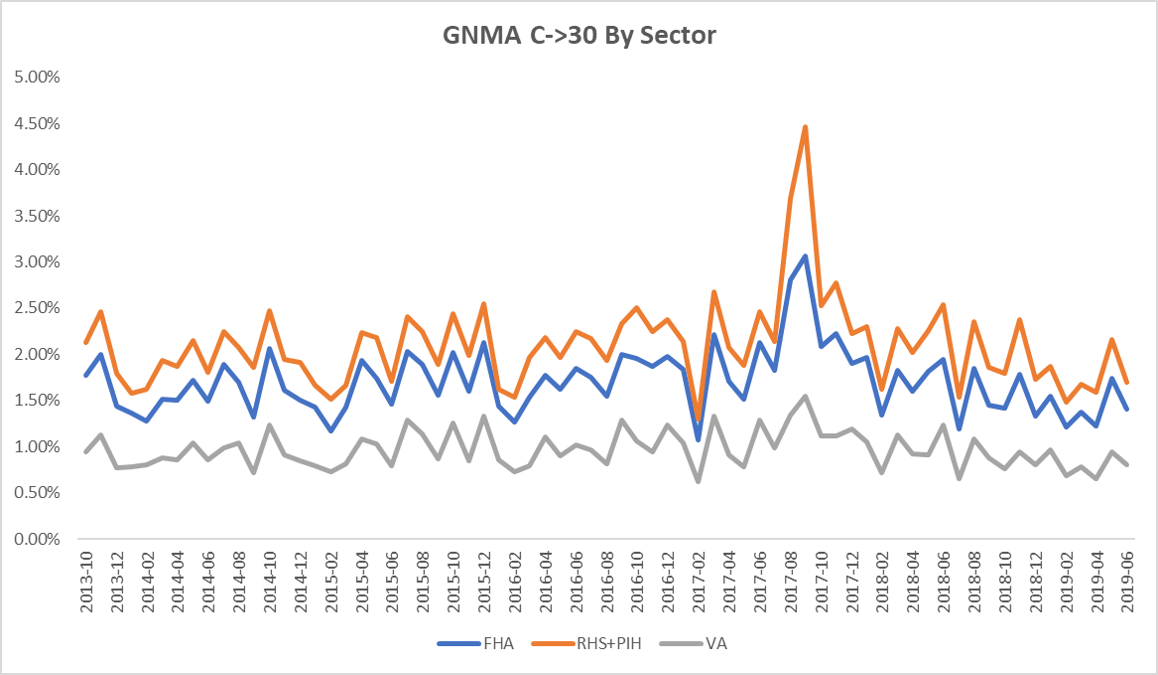
Figure 1: C->D30 rate by sector across observation periods Source: MIAC Analytics™
Is this substantial FHA/VA performance disparity explained by observable borrower, loan, property, and economic attributes? Figure-2 suggests that this is indeed possible, since most VA credit drivers are substantially better than FHA credit drivers.
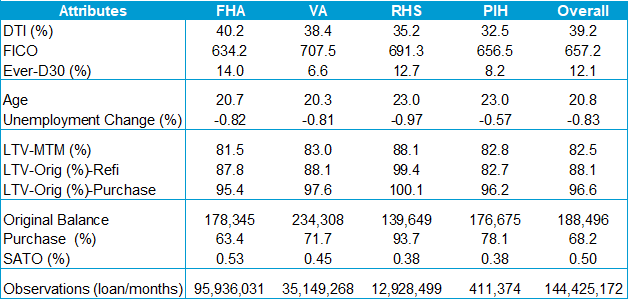
Figure 2: VA Credit Drivers Source: MIAC Analytics™
FHA Loans are Worse Even After Controlling for Characteristics
Do the worse characteristics of FHA loans fully explain their weaker credit performance? In order to address this important question, we need a statistical model that relates the probability of a C->D30 transition to observable loan-level characteristics. We have estimated and implemented models for all relevant transitions in our CORE-5.1 model, which is available in our WinOAS™ platform. For each transition – including the C->D30 transition under discussion here – we estimated a generalized logistic model using the GNMA loan-level data described above. By generalized logistic, we mean that raw explanatory variables are transformed as needed to achieve the necessary behavioral response profile. In subsequent articles, we’ll delve into our model development process and explanatory factors in more detail.
Our most important finding is that, even after adjusting for their worse observable characteristics, FHA C->D30 rates are, on average, 1.3x higher than VA C->D30 rates. We say “on average” because, in a probabilistic model, the impact of any attribute depends upon the levels of other attributes. In other words, about 62% of FHA underperformance can be explained by their worse characteristics (i.e., 1.8-1.3/0.8) with 38% unexplained (i.e., 0.5/0.8). We did some sensitivity testing and found that this conclusion is robust to the details of the model specification. Further, the weaker attribute-adjusted performance of FHA versus VA has been documented by other researchers using alternative datasets and methodologies (see, for example, Goodman et al [2014])¹.
The reason for this disparity is that VA loans have, on average, better unobserved characteristics, and Goodman et al outline a number of possibilities, such as the VA Residual Income Test, VA Servicing Practices, the Military Culture, and so on. The list of potential unobserved characteristics is endless, and may well include more adverse down payment assistance in the FHA sector, a higher percentage of thin credit files, lower reserves, higher payment shock from the prior loan, etc.
Another way to visualize the impact of sector and the importance of better VA observed characteristics is to display segmented model fits versus some important credit attribute. Figure 3 shows model fits versus FICO score – one of the most important drivers of mortgage credit. It is evident that our CORE-5.1 model captures the impact of FICO very well for both sectors. At every level of FICO, FHA performance is worse than VA performance.
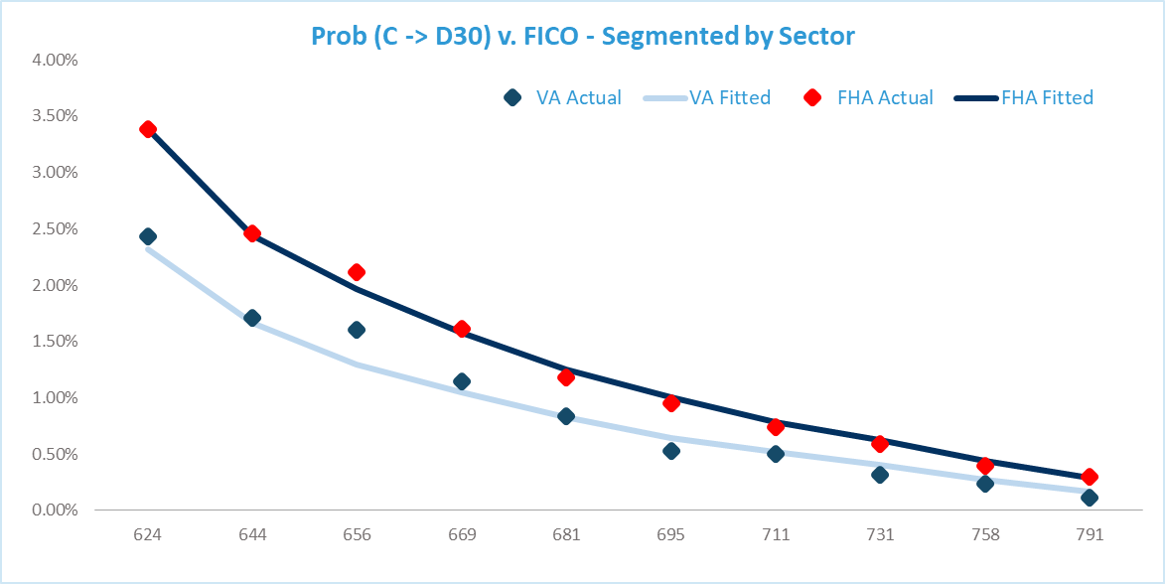
Figure 3: Prob (C -> D30) v. FICO—Segmented by Sector Source: MIAC Analytics™
GNMA Credit Models Should Include the FHA/VA Mix
Sector is a very important credit attribute readily available to clients, and it should be used when assessing credit risk. GNMA credit models which ignore the impact of sector are mis-specified and cannot be relied upon for accurate projections.
.
Research Insights: Credit Risk in GNMAs – October 2019
Author
Dick Kazarian, Managing Director, Borrower Analytics Group
Dick.Kazarian@miacanalytics.com
¹ Goodman, Seidman, and Zhu, 2014, Urban Institute, “VA Loans Outperform FHA Loans. Why? And What Can We Learn?”