Based on the changes to key market indices, month-over-month MIAC’s Conventional 30-YR GSA Index declined by 3 basis points, but there was considerable price volatility along the way. In the last week of August, MSR’s rallied to recover nearly all the earlier losses. Some of the rally was attributable to national mortgage delinquency rates being recorded at their lowest level since the year 2000. As measured by Bankrate, month-over-month primary market 30-YR Conventional mortgage rates declined by 8 basis points to end the month of August at 3.77%. Quarter-over-quarter, 30-YR Conventional rates experienced a slightly lesser 5 basis point decline. While this amount of mortgage rate movement may produce only a minimal shift in value, there was also a decline in benchmark earnings rates. In comparison to the M-o-M decline in base mortgage rate, the 5-YR Swap Rate which is MIAC’s benchmark for earnings rates declined in a non-parallel fashion to end the month at 1.76% or approximately 14 basis lower than July’s closing rate. Q-o-Q the 6 basis point decline in the 5-YR Swap rate was in approximate alignment with the quarterly change in primary mortgage rate.
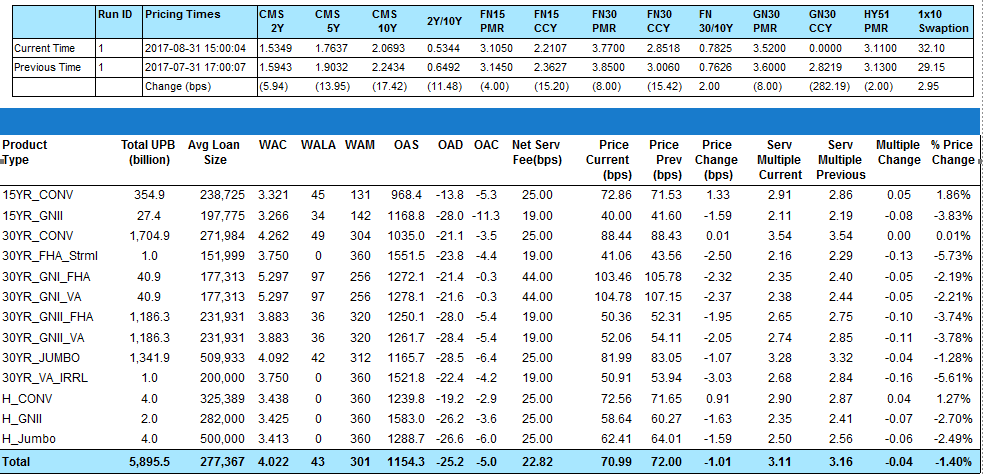
Figure 1: Period-over-Period Price Change by Product Source: MIAC Analytics
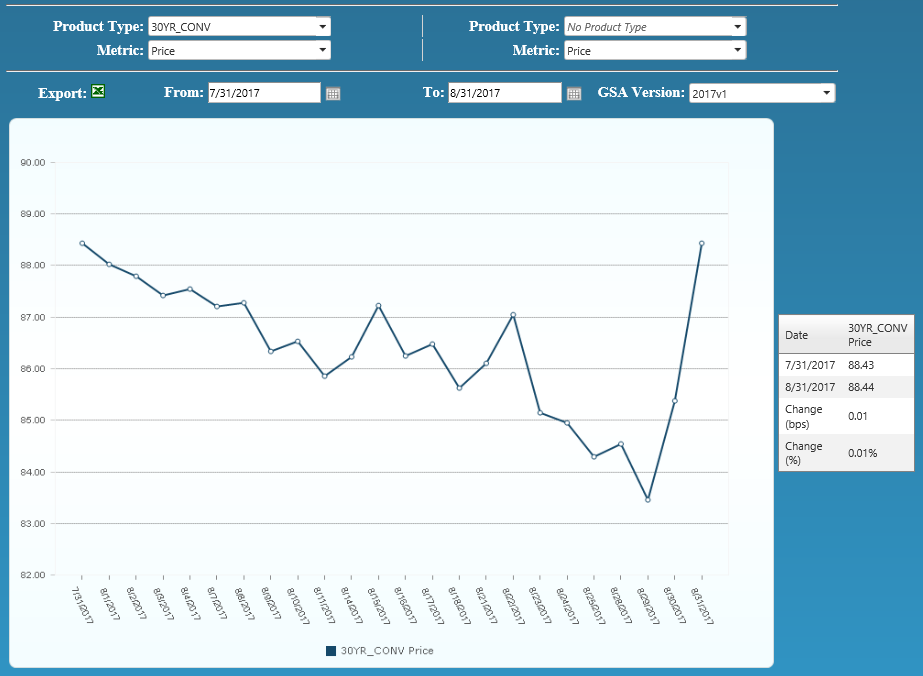
Figure 2: Conv 30-YR GSA Index 1 Source: MIAC Analytics
The residential one-to-four-unit delinquency rate which includes loans that are one or more payments past due but not in foreclosure, declined to a seasonally adjusted rate of 4.24 percent at the end of the second quarter of 2017. Just as promising, the foreclosure inventory rate was at its lowest level since the first quarter of 2007 and the seriously delinquent rate (90 or more days past due including foreclosures) dropped to a ten-year low.
Harvey/Irma Impact is Significant
With any discussion on delinquency rates, one has to recognize the impact of hurricanes, Harvey and Irma. Despite covering a wider area, the overall impact of Irma in terms of loss was less than that of Harvey. Projections are that the residential real estate loss associated with Harvey was $45 to $55 billion vs. $30 to $40 billion for Irma. Likewise, commercial real estate losses for Harvey are being projected at $16 to $20 billion vs. $5 to $9 billion for Irma. While both storms were devastating, Harvey caused significantly more flooding to the residents of Texas whereas most of the damage in Florida and to a lesser extent surrounding states was caused by wind damage. What separates the two storms is that more homes in Florida have flood insurance as compared to Texas residents and damage caused by wind is covered by homeowners insurance. With an estimated 15% of the homes affected by flooding in the Harvey affected areas having flood insurance, it’s projected that delinquencies in and around Houston will experience a short term increase in delinquencies. Using Hurricane Katrina as a benchmark, early projections are that 25% or more of the borrowers in the areas impacted by Hurricane Harvey could become delinquent. In sheer numbers, that could mean that as many as 300,000 borrowers will miss at least one payment on their loan with 160,000 missing three or more payments.
MIAC has been flagging assets in areas declared by FEMA to be in potential disaster areas, increasing the default probability on those assets, and providing a loan level listing of the potentially impacted loans. The number of impacted assets relative to the overall size of portfolio will ultimately determine the degree of impact on the MSR pricing.
MSR portfolios with similar collateral attributes can experience a significant variance in voluntary and involuntary prepay performance. Similar to buyers of MSR bulk packages, MIAC directionally adjusts the market expectations of prepay speed projections in accordance with how fast or slow a firms actual prepays are relative to national average. By no means will a buyer synchronize their forward prepay projections right on top of a firm’s historical actual speed but they will adjust their forecasts up or down based on actual performance metrics.
GNMA Performance
Increasingly Ginnie Mae sellers are looking to take advantage of a vastly improved Ginnie Mae transaction market and at levels that are far superior to this time last year. 30-YR GN2 3.0’s Issue Year 2016 with FHA collateral are being marked at 3.25 multiple on August 31, 2017 and 30-YR GN2 3.0’s Issue 2015 with FHA collateral were being marked at 2.40 multiple on August 31, 2016. Trading levels on seasoned, lower average balance offerings will vary but have generally ranged in the mid to high 2 multiple range, while stressed Ginnie Mae offerings are subject to a much wider range including one deal brokered by MIAC this quarter that traded without reps and warrants.
The size of the offering can heavily influence who bids and at what level they bid but for Conventional offerings in excess of $2 to $3 billion or greater, bid prices at 4 to 4.3 multiple levels are not unrealistic. Low delinquency Conventional 30-YR product can trade in the mid-4 multiple range although sellers continue to experience buyer resistance at asking levels in excess of a 4.5 multiple. The smaller Conventional packages are seeing an uptick in trading volume as well.
Mike Carnes, Managing Director, MSR Valuations, Capital Markets Group
Residential MSR Market Update – September 2017