By Dick Kazarian, Managing Director, Borrower Analytics Group
As we’ve discussed in previous reports and documents, our CORE™ multi-factor prepayment model incorporates all of the explanatory variables displayed in Figure 1. We handle additional explanatory variables as over-rides to this base model. These expanded variables include FICO score, channel, loan purpose, occupancy, property type, and several others. Finally, our software applications give users complete flexibility to incorporate any other desired variables, such as servicer, streamlined vs. cash-out refinance, prior modifications, HARP eligibility, etc.
A well-specified prepayment model needs to handle the large number of factors displayed in Figure 1 and discussed above. Equally important, the interaction among these factors needs to be carefully specified and calibrated. In this section, we take a closer look at the impact of loan age on GNMA voluntary prepayments within our CORE™ Residential Fixed Rate model.
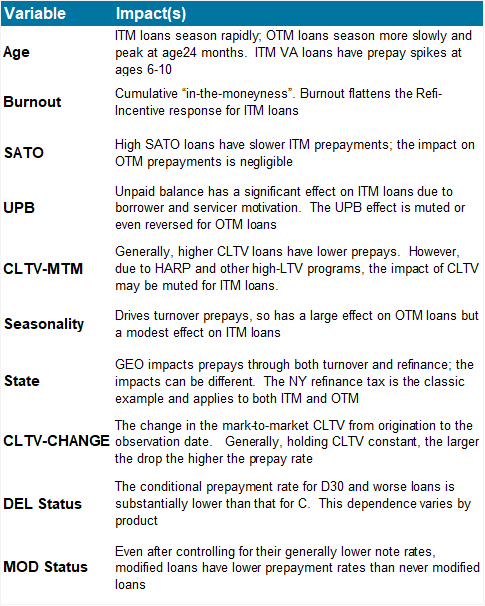
Figure 1: CORE Prepayment Model: Base Attributes Source: MIAC Analytics™
First, loans that are out of the money generally have a pronounced age effect. By out-of-the-money (OTM), we mean loans whose note rates are below the market rate and hence have little incentive to refinance. OTM prepays consist primarily of home sales or housing turnover, with borrowers unlikely to move after they have just purchased a home. This is because their housing and financing choice reflected their objectives and constraints at the date of purchase. Over time, borrower circumstances change, and the probability of a move gradually increases. Examples can include: a new job offer, an increase or decrease in income or wealth, a change in marital status, etc. By 30-36 months, the age effect peaks and is flat thereafter. This can be clearly seen for monthly prepayment rates for both FHA and VA. The bottom lines in Figure 2 display age profiles for FHA loans that are between 50 and 100 bps OTM. ACT refers to the actual observations while FIT refers to our fitted model. Monthly FHA OTM prepayment rates peak at about 1% at age 30 and are flat thereafter. The bottom two lines in Figure 3 displays age profiles for VA loans that are likewise between 50 and 100 bps OTM. Monthly VA OTM prepayment rates are very similar to FHA OTM prepayments.
Note that (a) our model fits these datasets very well and (b) VA housing turnover is somewhat higher than FHA turnover at very early ages, which reflects the different demographic profiles of these two sectors.
Second, the behavior of FHA loans that are in-the-money (ITM) is dramatically different than FHA OTM loans. This is evident by comparing the top two series in Figure 2 (which consist of loans that are ITM by 50-100 bps) with the bottom two series. In fact, for FHA ITM loans, prepayments display very flat age profiles – they are high throughout, though burnout does start to accumulate after a while. This is because ITM prepayments are primarily refinances – the borrower remains in the home but is optimizing their financing. Generally, borrowers will refinance whenever they find it optimal to do so. Once again, we see that our model fits the data quite well.
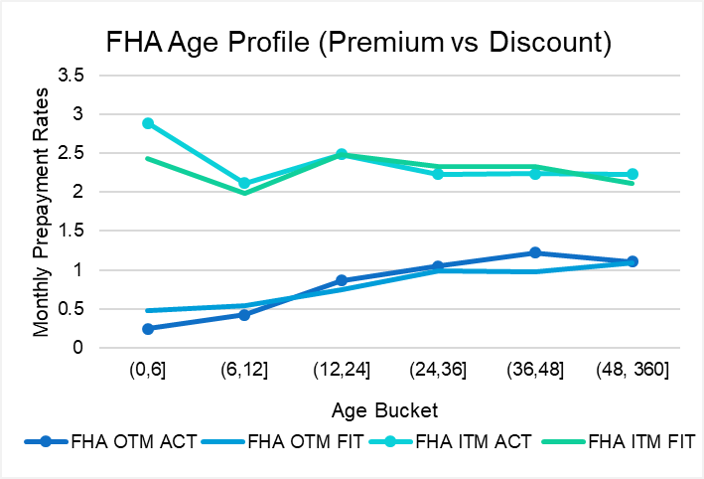
Figure 2: FHA Age Profile (Premium vs Discount) Source: MIAC Analytics™
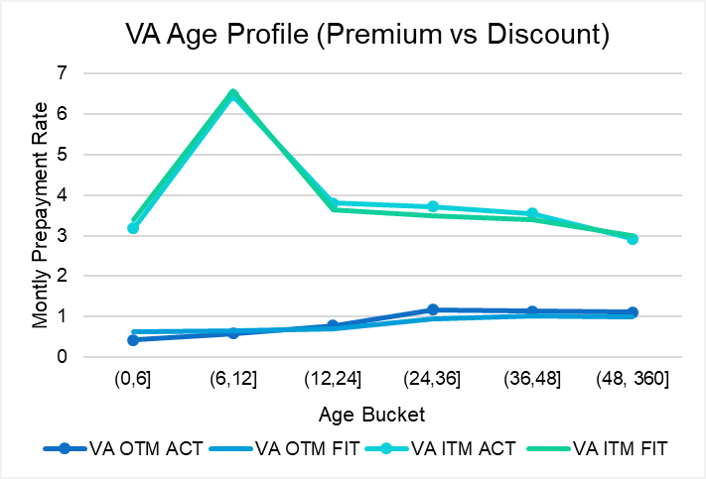
Figure 3: VA Age Profile (Premium vs Discount) Source: MIAC Analytics™
Third, the behavior of VA ITM loans that are in the money is dramatically different than both VA OTM loans as well as all FHA loans. This data is shown in the top two series in Figure 3. VA ITM speeds are much faster than FHA ITM speeds across all age buckets. This is partly due to their better characteristics, such as higher balances, higher FICOs, and lower DTIs. However, even after adjusting for their better attributes, VA ITM speeds are higher. The prepay spike near 6-10 WALA is very significant and has been the source of much discussion and policy proposals by both the DVA and GNMA. We’ll defer a more comprehensive discussion of the VA ITM age peaks to a future issue of MIAC Perspectives. Figure 4 compares FHA v. VA in the same chart for ITM loans to see the difference more vividly.
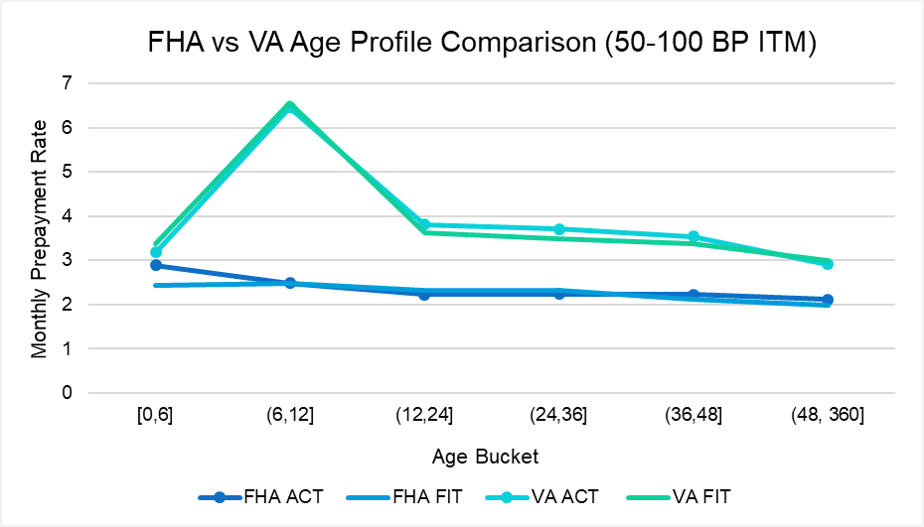
Figure 4: FHA vs VA Age Profile Comparison (50 – 100 BP ITM) Source: MIAC Analytics™
Collectively, these data reinforces a point we have been making for over the past several years – the behavior of FHA and VA loans could not be more different, from both a credit and prepayment perspective, even after adjusting for their distinct attributes. For additional details on the credit differences between FHA and VA, see one of our recent CORE™ Webinars. Their only common characteristic is that they have government-provided credit protection in front of the GNMA guarantee. Stated more directly, models that purport to describe the composite GNMA credit and prepayment behavior should be relegated to the dustbin of history.
MIAC Perspectives: A Closer Look at the Impact of Loan Age on GNMA Prepayments in MIAC’s CORE™ Models
Author
Dick Kazarian, Managing Director, Borrower Analytics Group
Dick.Kazarian@miacanalytics.com