By Dick Kazarian, Managing Director, Borrower Analytics Group
Each issue of our Quarterly Perspectives consists of several articles covering different topics of interest to mortgage market participants. This article reviews 1) Mortgage Rates and Spreads, 2) Prepayment Changes from our MIMs Survey, and 3) Extension Risk Concerns.
30-Year Mortgage Rates and Spreads
Figure 1 displays quarterly snapshots of primary (PMR) and secondary (CCY) 30-year Conventional mortgage rates from Q4 2020 through Q1 2022. During 2021, primary rates backed up 55 bps, while secondary rates increased by 76 bps. As a result, the primary/secondary spread narrowed by a significant 20 bps over 2021.
Rate changes over Q1 2022 have been much more dramatic. First, the Constant Maturity Swap (CMS) curve experienced a significant bear flattener. That is, the CMS-2Y backed up significantly more than the CMS-10Y (160 bps vs. 82 bps). The result was an inverted yield curve as of quarter end, accompanied by much industry chatter about the ability of inverted curves to predict subsequent recessions.
Whereas the CCY/CMS-10Y spread widened considerably by 61 bps, the PMR/CCY spread tightened by a mere 6 bps. As a result of the twin effects of a bear flattening in the CMS curve and a widening of the CCY/CMS spread, PMR-30 rates hit 4.67, the highest reading since late 2018.
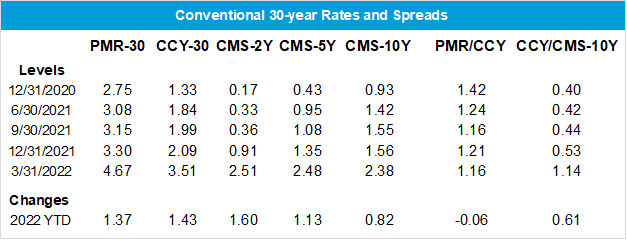
Figure 1: Conventional 30-year Rates and Spreads Source(s): FHLMC, TRACE, MIAC Analytics™, MIAC Internal Calculations
This primary/secondary (PMR/CCY) spread is driven by numerous factors, including g-fees, servicing and origination costs, and numerous other factors. Aside from the g-fee, this spread can be considered the retail markup over the wholesale cost of mortgages (i.e., the secondary rate). Many of these factors change slowly over time and only impact the long run level of the PMR/CCY spread. For example, technological changes (e.g., e-closings), policy shifts (e.g., appraisal waivers), and the entry of FinTech lenders are expected to gradually lower origination costs over the next few years.
In contrast, the biggest driver of short run dynamics in the PMR/CCY spread is the ability of originators to exercise market power. When rates rally sharply, the demand for refinances increases. Since capacity is fixed in the short run, originators can and do adjust primary rates to ration excess demand. This results in a widening of the PMR/CCY spread, as well an increase in gain on sale margins. Additionally, the larger the newly refinanceable universe, the greater the pricing power. Over time, as the outstanding mortgage universe gets refinanced and capacity constraints abate, the spread will narrow to an equilibrium level driven primarily by the long run factors listed above.
This PMR/CCY spread compression is what we have observed since the beginning of 2021, continuing through Q1 2022. In fact, many observers believe that we are now close to the minimum spread needed for originators to make a normal economic profit. As a result, subsequent increases in CCY will have little impact on the PMR/CCY spread. In addition, decreases in CCY rates will also have a muted impact on the PMR/CCY spread. This is because the prior refinance waves have dramatically reduced the size of the prospective refinance universe, even if rates rally 150-200 bps from here. Taken together, we expect a very low and stable PMR/CCY spread relative to recent history.
In sharp contrast to the PMR/CCY spread, we expect significant volatility in the secondary/swap (CCY/CMS) spread over the next year and perhaps beyond. We have already seen this play out in Q1 2022. This divergent behavior of the two spreads occurs because they are driven by an entirely different set of factors. The CCY/CMS spread is driven by implied volatility, the Fed’s balance sheet activity, the slope of the swap curve, generic refinance efficiency, and other supply/demand factors. The biggest driver of the Q1 2022 CCY/CMS widening was the Quantitative Tightening (QT) by the Federal Reserve. And at least one prominent dealer is predicting outright sales of MBS by the Fed later this year. Moreover, the flattening of the CMS curve resulted in a widening of the CCY/CMS-10Y spread. This is because the CCY rate depends upon the entire CMS curve, not just the 10-year maturity. Finally, rate volatility is also likely to keep the CCY/CMS spread both elevated and volatile.
The increase in the relative volatilities of the CCY/CMS spread relative to the PMR/CCY is a good reminder of why naive extrapolations of historical patterns can result in poor predictions of future behavior.
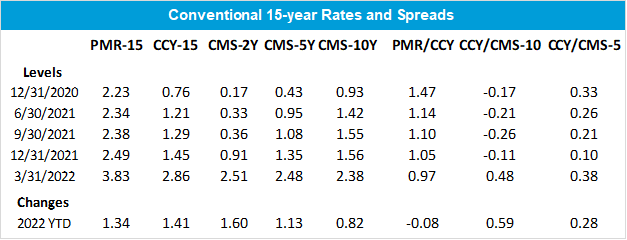
Figure 2: Conventional 15-year Rates and Spreads Source(s): FHLMC, TRACE, MIAC Analytics™, MIAC Internal Calculations
15-Year Mortgage Rates and Spreads
These same patterns are observed for the 15-year Conventional market, as shown in Figure 2. In fact, the compression of the PMR/CCY spread for the 15-year was marginally greater than for the 30-year (dropping 8 bps vs. 6 bps). This is because the 15-year market is primarily a refinance market, whereas the 30-year market is a blend of purchase and refinance originations. And purchase origination activity is too stable to produce spikes in demand. While 15-year originations may well maintain their share of the refinance market, their share of total originations will plummet along with the overall refinance share.
The complete time series of month-end rates and spreads since the start of 2021 is displayed in Figure 3 and Figure 4.
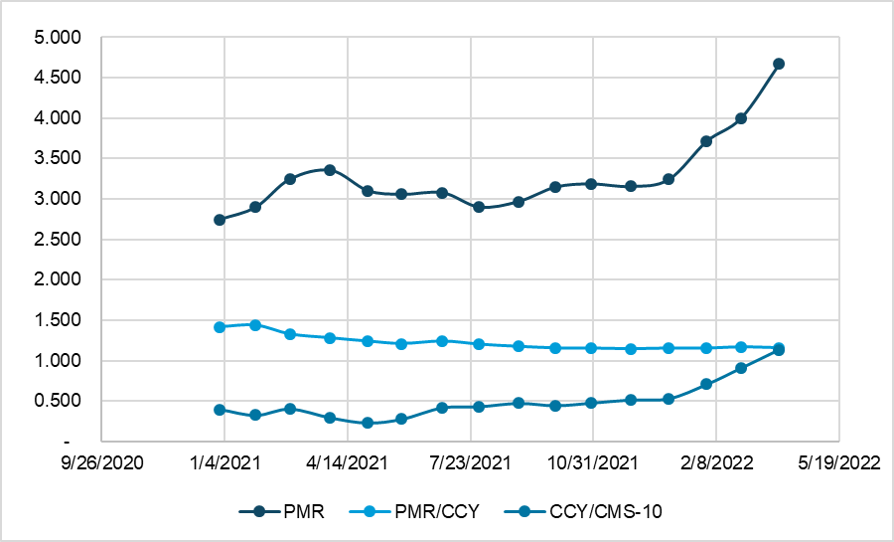
Figure 3: Conventional 30-year Rates and Spreads Source(s): FHLMC, TRACE, MIAC Analytics™, MIAC Internal Calculations
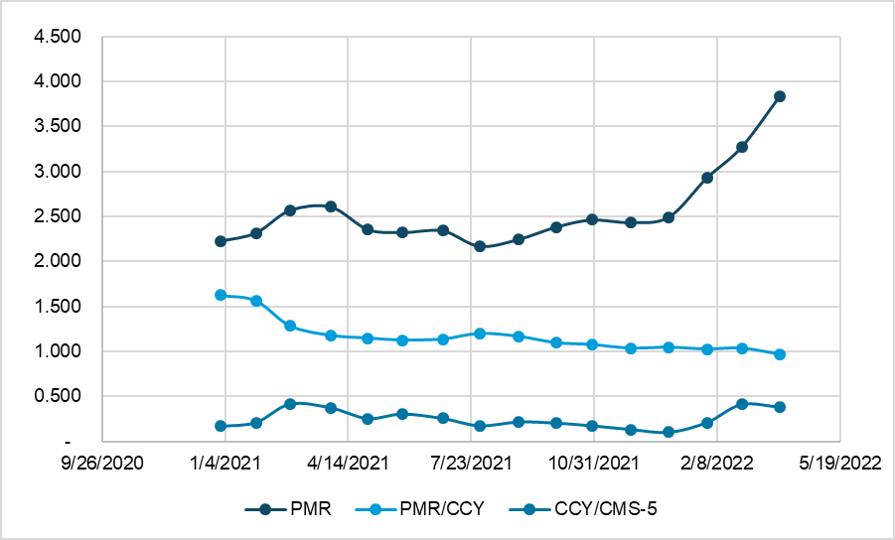
Figure 4: Conventional 15-year Rates and Spreads Source(s): FHLMC, TRACE, MIAC Analytics™, MIAC Internal Calculations
Collectively, these dynamics continue to underscore the need for careful independent modeling of the PMR/CCY and the CCY/CMS spreads (i.e., using separate modeling frameworks and input variables). The evolution of both spreads, in either a single-path or an OAS framework, will have a significant impact on valuations, risk sensitivities, and stress valuations.
Improved Market Transparency with MIAC Data Products
In order to track and analyze rates and spreads, it is necessary to have high quality data on all three series. CMS rates have excellent price discovery and are readily available from numerous vendors. For primary mortgage rates, we use the FHLMC survey rate, adjusted for the weekly averaging implicit in their survey methodology. However, we acknowledge that the choice of primary rate series is much discussed among market participants.
This leaves the CCY, the secondary mortgage rate. Its computation involves two components. The first component is accurate TBA pricing. Although the TBA market is generally quite liquid for coupons close to parity and for the first few settlement months, careful processing of TRACE data can result in improved price discovery relative to alternative benchmarks. MIAC has developed an IOSCO-compliant Price Fixing methodology, referred to as MIAC TBA Fixings™. Our analysis has found that this methodology provides more accurate end-of-day pricing than competing approaches.
The second component for an accurate secondary rate computation is the interpolation/extrapolation methodology. This methodology is particularly relevant when the entire liquid TBA stack is either at a premium or at a discount. Over the past few years, we’ve seen several episodes where the entire TBA stack was at a premium and extrapolation was needed for the CCY100 calculation. Our tracking shows that our MIAC CCY ™ series can differ from alternative vendors by more than 5-7 bps. For more information on these data products, please contact your Sales Representative.
Prepayment changes from our MIMs Survey
Our MIMs Prepayment Survey for key coupon aggregates over the past quarter is displayed in Figure 5. In this analysis, the underlying cohort attributes are held constant, and the changes reflect the impact of increases in the primary mortgage rate alone. These prepayments are median average life equivalent (ALE) prepayment speeds, inclusive of buyouts. For each coupon aggregate, we calculate the median over all contributors for each cohort, then calculate a UPB-weighted average to aggregate up across vintages to the product/coupon level.
Several themes are apparent from Figure 5. First, the PMR backup over the quarter, one of the largest quarterly backups observed over the past half-century, has resulted in a significant decline in forecasted prepayment speeds. Second, the lower coupons tend to have more muted responses, as they were already OTM at the start of the quarter. A third and final observation is that the ATM and ITM Ginnies generally have higher prepays than their Conventional counterparts. This is due to a combination of 1) VA speeds being faster than Conventional speeds, 2) higher EBOs (mostly within FHA), 3) near-ATM FHA speeds being faster than Conventional due to FHA to Conventional refinancing, 4) slower prepayment burnout accumulation in the Ginnies, and 5) very efficient streamlined refinance options in FHA/VA.
Figure 5: MIMs™ Prepayment Projections Source: MIAC Analytics™
Extension Risk Concerns Replace Prepayment Risk Concerns
As a result of the backup, extension risk has largely replaced prepayment risk as a top concern among mortgage market participants. This concern is exacerbated when using OAS-based analysis, since prepayments need to be projected for rate scenarios, where loans can be OTM by 400 bps or more. There are several interrelated but distinct issues related to this “prepay floor”.
First, when base case prepayment rates are low, the sensitivity of MBS prices and durations to small changes in prepayment rates increases substantially, hence the heightened concern regarding extension risk. In contrast, in premium environments, the same absolute difference in prepayment rates is much less impactful on prices/OAS and durations.
Second, there is considerable uncertainty regarding pure housing turnover and the “lock-in” effect. The “lock-in” effect refers to the tendency for homeowners with deep OTM loans to defer moving so that they can monetize the value of their low coupon liability. Some analysts are going back to the early 1980s to gauge the potential impact of a dramatic sell-off. We will have more to say about this in the weeks ahead, but it should be noted that the ability of many professionals to work from home may play a significant role. The ability of employees to work from home (WFH) will increase the value of this “move deferral option”, since employment choice and residence choice can be separately optimized by many households. However, the ability to WFH will also stimulate migration itself. As an illustration, a recent Wall Street Journal article entitled “The Great Pandemic Wealth Migration”, published on June 3, 2022, analyzed IRS data to track migration from high-tax to low-tax states. All this means that a mechanical calibration of models to prior sell-off environments is unlikely to yield good predictions for future behavior. And in any case, predicting housing turnover itself is no simple matter, given demographic changes among homeowners, even without all the COVID/WFH complications.
A third complication is that borrowers also refinance OTM loans. Most commonly, this is done to extract equity (which now exceeds $11 trillion). As covered in our Winter 2022 Issue of MIAC Perspectives, there is significant uncertainty regarding the equity extraction mechanism. At some point, borrowers will extract equity using second lien products to preserve the value of their low coupon mortgage liability. Recent data from the Fed shows that HELOC utilization balances are on the rise.
Fourth, curtailments or partial prepays are likely to come under greater scrutiny and analysis. Historically, these rarely exceed 2-3 CPR. When prepays are running at 30-60 VPR, curtailments are mostly rounding errors and are rarely discussed. But when base case prepays are in the 3-8 range, the relative importance of curtailments increases.
Fifth, defaults and buyouts will play a relatively more important role for the same reason as curtailments. This is likely to be most important in the FHA sector, where defaults and buyouts are generally higher than in Conventional, VA, and Non-Agency.
MIAC Perspectives: Market Overview
Author
Dick Kazarian, Managing Director, Borrower Analytics Group
Dick.Kazarian@miacanalytics.com
View MIAC Perspectives – Spring 2022 Issue