By Mike Carnes, Managing Director, MSR Valuations Group
MSR Pricing
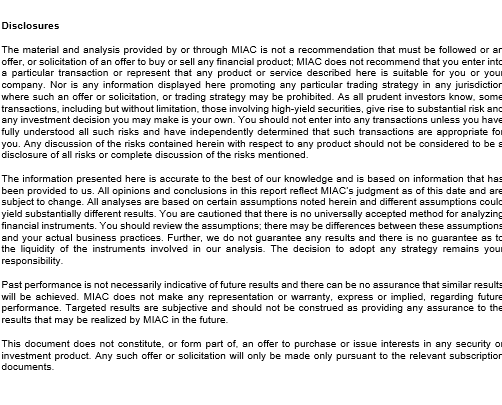
MSR prices continued their dramatic ascent in Q1 2022. As displayed in Figure 1, MIAC Generic Servicing Assets (GSAs™) experienced first quarter price increases across all four sectors and both vintages, with a UPB-weighted Q-on-Q increase of 0.97 multiple (or 24.9%).
Within Conventional products, pricing increased substantially more for 30-year than for 15-year, in both absolute (0.79 multiple), as well as relative (27.2%) magnitude. This is primarily due to the less negative 15-year option-adjusted durations (OADs) at the start of 2022 (-13.1) vs. the substantially more negative 30-year OADs (-20.1). In contrast to last quarter, the backup in 30-year primary rates (PMR30) in Q1 2022 of 1.37 was virtually identical to the PMR15 backup of 1.34.
Within the 30-year sectors, Conventionals had the largest price increases (27.6%), followed by FHA (22.9%) and VA (20.3%). Note also that, for each sector, the seasoned vintages experienced greater price increases than the newly issued vintages (defined as pool age less than 24 months). This is because the seasoned vintages have much higher WACs, and so benefitted much more from the rate sell-off. In other words, loans that are closer to in-the-money (ITM) have greater rate sensitivity than loans that are already out-of-the-money (OTM). This is also evident from the larger VPR drops on the seasoned vintages.
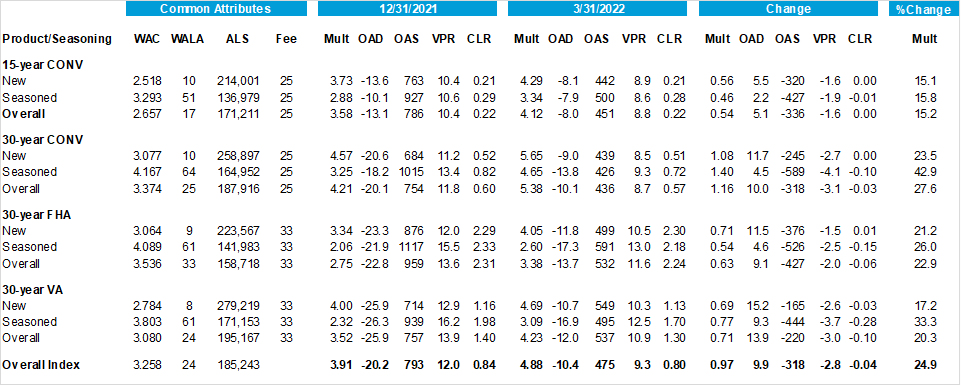
Figure 1: Impact of Market Changes on GSA™ Cohorts (YTD ending 03-31-22) Source(s): eMBS, MIAC Analytics™, MIAC Internal calculations
MSR Duration Changes
The option-adjusted duration of the GSA universe became substantially less negative over Q1 2022, moving from -20.2 to -10.4. The OAD change was similar across the 30-year sectors, and much more muted for the 15-year Conventionals. The OAD impact of the rate backup depends on numerous factors, the most important of which is the rate sensitivity of prepayments (i.e., the slope and curvature of the s-curve). As a result of these OAD changes, servicers who hedge their MSRs need much smaller long TBA positions to remain duration neutral.
The sensitivity of OADs (and other risk sensitivities) to changes in collateral attributes and market conditions is one important reason that MSR Hedge Advisors need to have reliable analytics at their disposal. MIAC’s MSR Hedge Advisory team relies upon our internally developed CORE™ Model Suite. Accurate measurement of MSR price sensitivities is a complex and difficult challenge. Having the MSR Hedge Advisory, Model Development, and Software Development groups within a single firm facilitates a continuous feedback loop that simultaneously improves both the hedging recommendations and the underlying models. In contrast, MSR Hedge Advisors that rely on externally-developed vendor models can easily overlook model limitations as well as implementation problems. Many model limitations are qualitative in nature and are difficult or even impossible to fully document.
It is worth repeating that MIAC GSA attributes are held fixed over the course of each calendar year to help market participants better understand constant-quality MSR pricing and risk sensitivities. This is what is displayed in Figure 1 above. Actual MSR portfolios will generally see an even larger shrinkage in duration and larger increase in price as their average note rates reset downward. However, in contrast to prior quarters, once the MSR universe is mostly OTM, the difference between actual MSR portfolios and the GSA benchmarks will diminish. This is because lower overall prepayments translate into more gradual changes in the MSR universe.
MSR Pricing and Risk Sensitivities across vintage aggregates
Based on client feedback from our prior publications, we have increased the granularity of our vintage aggregates. Figure 2 displays three vintage breakouts: New/Unseasoned (pool age less than or equal to 24 months), Moderately Seasoned (pool age greater than 24 but less than or equal to 60 months), and Fully Seasoned (pool age greater than 60 months).
Several patterns in Figure 2 merit attention. It is evident that the unseasoned vintages have the highest multiples. However, for all 30-year sectors, the fully seasoned vintages have higher multiples than the moderately seasoned vintages. In order to understand why this occurs, it is useful to do a quick recap of the impact of selected drivers on MSR pricing, as we explain below. While many readers will consider this just a review of MSR 101, we hope to convey the idea that numerous factors get commingled into a combined vintage effect. As a result of these competing effects, the pricing across vintages can display almost any conceivable pattern.
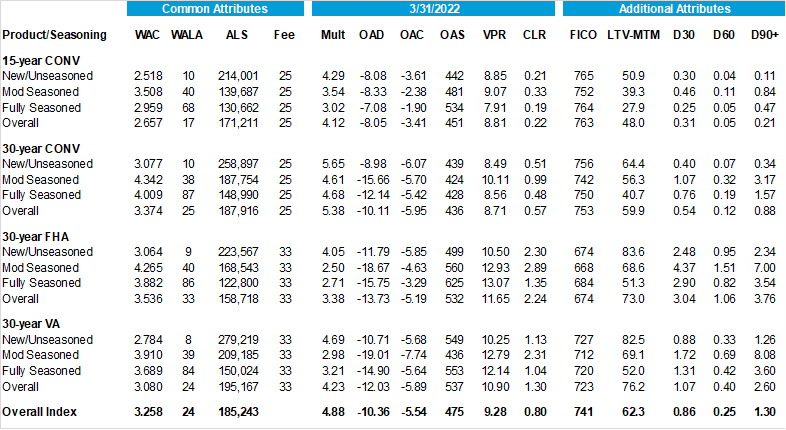
Figure 2: GSA ™ Characteristics and Outputs (Q1 2022) Source(s): eMBS, MIAC Analytics™, MIAC Internal calculations
The Impact of Balance
The pure effect of loan balance is a decrease of MSR values, since servicing fees are proportional to the UPB, while costs are unit-based. Older cohorts tend to have lower balances than newer cohorts, particularly when HPA is rising rapidly. The tendency of high UPB loans to prepay faster and regular amortization reinforces the tendency of original balances to increase over time.
The Impact of Remaining Amortization Term
The shorter the remaining term, the lower are MSR values. Again, this tends to make seasoned vintages less valuable.
The Impact of Prepayments (VPR)
Higher prepayments mean lower MSR values. Although prepayments tend to rise as a function of loan age, older vintages tend to be more burned out, which offsets the effect. In addition, there are many other drivers of prepayments that differ across vintages. As we see in Figure 2, the historical behavior of the PMR has resulted in moderately seasoned vintages having the highest WACs, which is the largest driver of VPRs. Older vintages tend to have lower LTV-MTMs as a result of accumulated HPA, which also tends to increase prepays.
The Impact of Credit (CLR)
Higher credit risk generally lowers MSR values for two reasons. First, liquidations terminate the servicing stream, and hence functions like VPR. Second, higher credit risk means substantially higher servicing expenses and unreimbursed shortfalls. In Figure 2, we see that the fully seasoned vintages have lower mark-to-market LTVs (LTV-MTM), courtesy of strong HPA over the past 10 years. Although these lower LTV-MTMs mean lower credit risk/CLRs, they also mean higher VPRs. At the LTVs displayed in Figure 2, the CLR effect dominates the VPR effect. This also raises the value of fully seasoned aggregates relative to moderately seasoned aggregates. Note also that, despite comparable LTV-MTM, the FHA CLRs are generally 2-3 times higher than the VA CLRs. This reinforces our assertion that FHA and VA loans have distinct credit behavior that requires fully segmented behavioral models. For more details, see one of our recent CORE Webinars.
The above discussion makes clear that the impact of vintage on MSR pricing has numerous confounding effects. These same effects also give rise to the patterns in OAD and OAC displayed in Figure 2. In fact, those relationships are even more nuanced. For example, the OAD depends upon both the average VPR as well as the sensitivity of the VPR to shifts in the PMR. Finally, it should be emphasized that there are numerous other drivers of MSR pricing and risk sensitivities. The above factors are those that vary most across vintages. For more information regarding MIAC’s Generic Servicing Asset (GSA) MSR Benchmarking tool, please reach out to your MIAC Sales Representative or visit our website. For more details regarding our credit and prepayment research, refer to our prior publications and sign up for our newsletter.
Q1 2022 MSR Transaction Activity
MSR transfer activity for Q1 2022 is summarized in Figure 3.
Two points are worth repeating before examining the results. First, these data summarize closed (i.e., settled) transactions, which lag the trade (i.e., executed P&S) date by at least a couple of months for bulk transfers. And generally, the executed P&S lags the final letter of intent (LOI) by 45-60 days. Although these data lag actual trading market activity, they provide a comprehensive summary of activity and characteristics. For more details regarding the timing of a typical bulk transaction, see article What is a Mortgage Servicing Right (MSR)?. Secondly, these data include bulk as well as flow (i.e., co-issue) transfers.
Overall, $172B changed ownership during the quarter. The average transaction size was less than $1B across all sectors, although this average is pulled down by co-issue transfers. Total transfers were highest in FNMA (54%), followed by FHLMC (29%) and GNMA (16%). Note that GNMA loans have somewhat smaller average balances than Conventionals, so the GNMA share is somewhat larger on a count basis (18%) vs. a UPB basis (16%).
As has been the case for some time, there is active participation across many buyers and sellers, including depositories as well as IMBs. Note that these calculations represent our best attempt to consolidate holdings and transfers among affiliated entities to avoid double counting. And while there are many participants, the largest transaction in each sector represents a significant fraction of the total volume (17-18%).
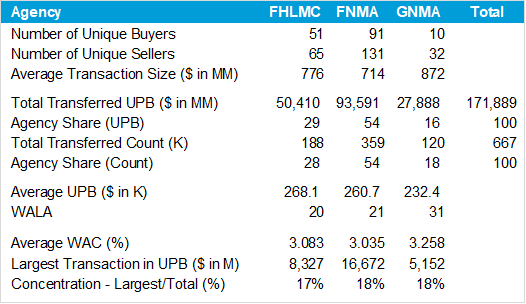
Figure 3: Completed MSR Transfers in Q1 2022 Source(s): eMBS, MIAC Analytics™, MIAC Internal calculations
Q-on-Q Transaction Comparison
Figure 4 compares Q1 2022 activity with Q4 2021. Completed transactions were much higher for FHLMC and GNMA in Q4, although again the lag between trade and settlement needs to be considered. Also, the number of participating buyers and sellers in Conventionals was quite a bit lower in Q4 vs. Q1, despite the higher volume. In fact, the number of unique sellers in FNMA almost doubled from Q4 to Q1. Concentration was also higher in Q4, especially for FHLMC and GNMA.
In terms of attributes, Q1 2022 transfers had substantially more loan seasoning than in the prior quarter (by 7-10 months). As covered in previous issues of MIAC Perspectives, S-Corps and LLCs typically have owners that benefit from the preferential tax treatment of long-term capital gains vs. ordinary income (i.e., certain portions of OMSRs held longer than 12 months). Given the backup in rates and the resulting decline in new loan production, the average loan age of portfolios is likely to continue to lengthen.
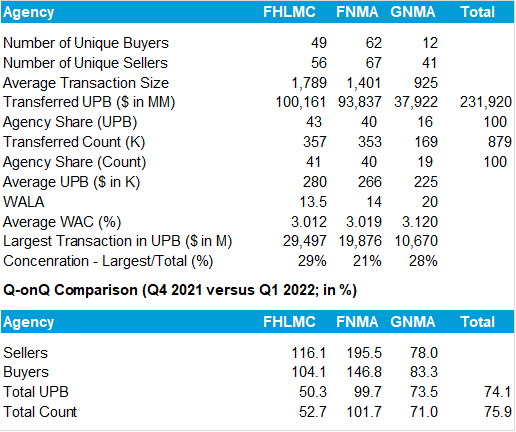
Figure 4: Completed MSR Transfers in Q4 2021 Source(s): eMBS, MIAC Analytics ™, MIAC Internal calculations
Transactions Outlook
In light of both pre-trade activity and completed trades we have observed thus far, 2022 will likely set a record for MSR transaction volume. With MSR multiples higher, origination profitability declining, and an increase in volume of 12+ months seasoned on the rise, increasing numbers of LLCs and S-Corps will be considering an MSR sale.
Assuming rates stabilize or continue to rise, another factor that will impact the amount of MSR sales activity going forward is whether a firm accounts for their MSRs at Lower of Cost or Market (LOCOM) or keeps them at Fair Value (FMV). Accounting for MSRs at LOCOM can result in less volatility in earnings and lessen the need or desire to hedge potential volatility. This is because any cushion at the homogenous risk-cohort level, while not recordable, can serve as a first line of defense against volatility created by a downward shift in primary mortgage rates. When interest rates rise, firms that account for MSRs at LOCOM are limited in their options when it comes to recognizing any market value increase. Short of a one-time conversion option to FMV accounting, the only other way to recognize the upside in value is to sell the MSR. With many firms now sitting on substantial amounts of unrecognizable cushion, the desire to sell can be strong.
MIAC Perspectives: MSR Market Update – Q1 2022
Author
Mike Carnes, Managing Director, MSR Valuations Group
Mike.Carnes@miacanalytics.com
View MIAC Perspectives – Spring 2022 Issue