Over the last month, the MIAC GSAs™ (Generic Servicing Asset) Conv_30 Index decreased by 1.02% and the GNII_FHA_30 index decreased by 2.47%.
In larger GSA cohorts which are actively traded in the MSR market, the Conv30_3.5_2016 cohort decreased by 1.51% and the GNII_FHA30_3.5_2016 cohort decreased by 2.21%. The good news is that the March hiccup did little to dampen outlooks. As expectations for rising rates continue to solidify we’re seeing a considerable increase in buyer interest in the negatively durated MSRs. During the month of March Conv_30 Index OAS’s remained virtually flat at 683 bps and GNII_FHA_30 Index OAS’s further tightened to 771 bps. In the case of Ginnie Mae, the OAS tightening reflects improved optimism as prepayment rates continue to decline. As Ginnie Mae stated in their December 7th memo, “To ensure the strength and liquidity of our MBS Program, Ginnie Mae is continuing to address activities that result in unduly rapid prepayments to investors in Ginnie Mae mortgage-backed securities” and address they are. In March, and despite stronger seasonal prepayments, speeds on newer Ginnie Mae cohorts declined significantly; a clear sign that their efforts are working.
After three continuous months of higher month-over-month rates, primary rates as measured by Bankrate® took a short breather in March. Month-over-month primary market 30-Yr conventional mortgage rates decreased by a nominal seven (7) basis points to end the month of March at 4.27%. Not to be ignored, however, year-to-date March 31st, 30-Yr conventional rates are still higher by an impressive forty-two (42) basis points. As rates trend higher further hikes will have an increasingly smaller impact on MSR values. When this occurs, servicers increasingly rely on earnings rates as a source for future upside in MSR values. In virtual lock step with primary mortgage rates, from end-of-month February to end-of-month March, the 5-Yr swap rate, which is a common MSR market benchmark for earnings rates, decreased by five (5) basis points to end the month at 2.71%. Also in parallel fashion with primary mortgage rates, quarter-over-quarter 5-Yr swap rates ended the 3-month period a full forty-six (46) basis points higher.
The perception that primary mortgage rates will continue to rise throughout the year seems well founded. After closing the month of March a full seven (7) basis points lower, primary rates are already fourteen (14) basis point higher during the first 20 days of April. Clinging to a brighter economic outlook the Federal Reserve, after raising its key short-term interest rate in March, maintained its forecast for a total of three hikes this year. In an effort to stay ahead of inflation the Fed anticipates raising short-term rates by a quarter of a percentage in June 2018 and again in December 2018. Assuming this occurs that would put the federal funds rate at 2.25% heading into 2019 when another three to four increases are anticipated. The latest rate forecast by the MBA predicts that 30-Year Fixed Mortgage Rates will end the year at 4.90% and total 2018 originations will be $1.61 trillion, which based on the latest MBA forecast is roughly 6% lower than 2017 totals. With actual CPR’s on 3% agency coupons consistently prepaying at 8% to 9% range in a 4% coupon market, it begs the question…What are the new CPR floors? In years prior many industry experts adhered to a floor that was around 6%. In today’s environment, and based on YTD prepay behavior by coupon, an 8% floor is not an unrealistic expectation.
Something I feel compelled to mention in this monthly installment is the increasingly widespread utilization of “Fair Market” values that may differ from one’s “Market” value. There are times when this practice might be acceptable, for example when there are no observable trades or lack of orderly market but we’re in the midst of a very robust MSR market. When accounting for MSR’s, “fair value” is used as a certainty of “market value” when a market price cannot be precisely determined.
Given the large quantity of observed trades and depending on one’s MSR portfolio, attempts to defend against an established market can be a risky approach given a much improved and now very healthy MSR market. Under US GAAP, “Fair Market” value is the price that would be received to sell an asset in an orderly transaction between market participants at the measurement date. In an orderly established market, any attempt to book or receive levels other than market supported values is strongly discouraged and should be avoided for reasons other than determining one’s own economic benefit. For those “not” in a position to see trades call your MIAC representative and/or consider MIAC’s GSAs™ for your benchmarking needs.
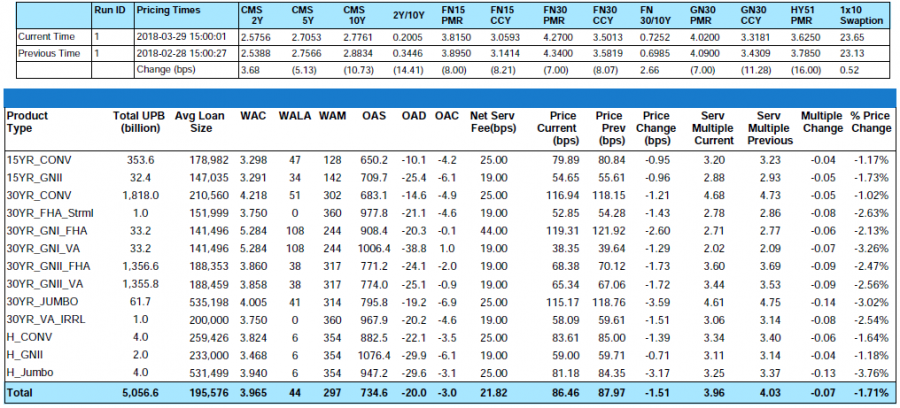 Figure 1: Month-over-Month Price Change by Product Source: MIAC Analytics
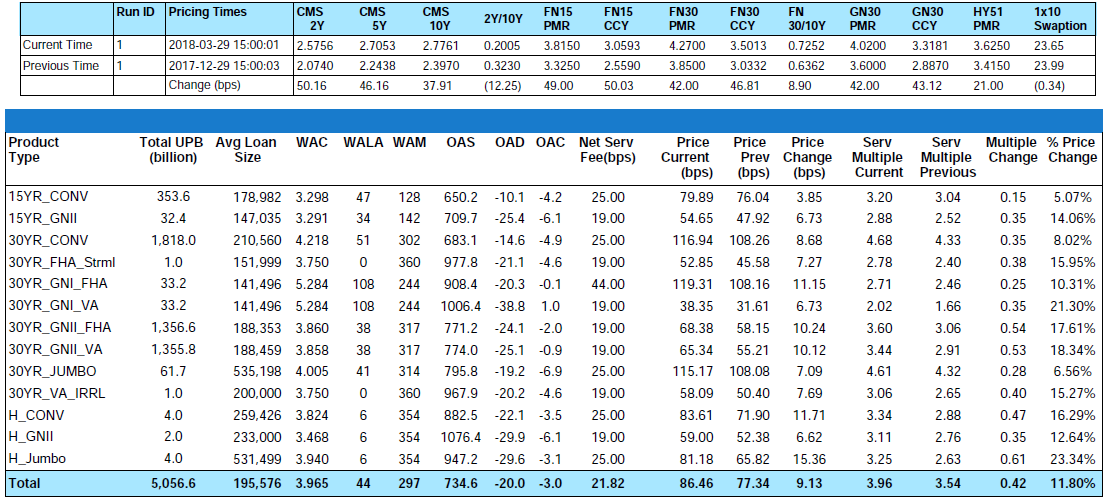 Figure 2: Quarter-over-Quarter Price Change by Product Source: MIAC Analytics
Trading Volume
March was a quieter month for MSR transaction activity but still not without multiple benchmarks. In consideration of recent transactions only, we’ll define “large” offerings as deals containing $1.5 billion or more in UPB. Out of the numerous “large” agency trades observed, bid levels generally ranged from a low of 4.2x to a high of 4.6x. With numerous year-to-date trades having executed in the low to mid 4 multiple range, clearly, those levels are no longer the outliers but instead the new norm for larger “out-of-the-money” agency deals. March offerings executing at these levels contained a blend of agency product emanating from well-capitalized sellers many of whom had national footprints and MSR’s that had weighted average note rates that were as much as 75 basis points lower than prevailing primary mortgage market rates.
Smaller conventional packages categorized as $500 million or less in UPB are trading at a robust pace too but at prices that “on average” range anywhere from 5 to 15 basis points lower than the bid prices obtained on larger offerings.
Trading levels on mostly newer “at-market Ginnie Mae offerings”, continue to lag conventional agency transactions and still range in the mid to low 3 multiple range. If the trend toward lower Ginnie Mae prepayments continues, we may witness increased buyer interest from those seeking improved margins at a time when competition (especially from the banks) are pushing agency values higher which in isolated instances is causing buyer yields to drop to 7% or lower. As with all transactions Ginnie Mae execution levels are heavily influenced by service fee level, geography, deal size, delinquency rates, borrower credit quality, counterparty strength, and last but not least, Mother Nature.
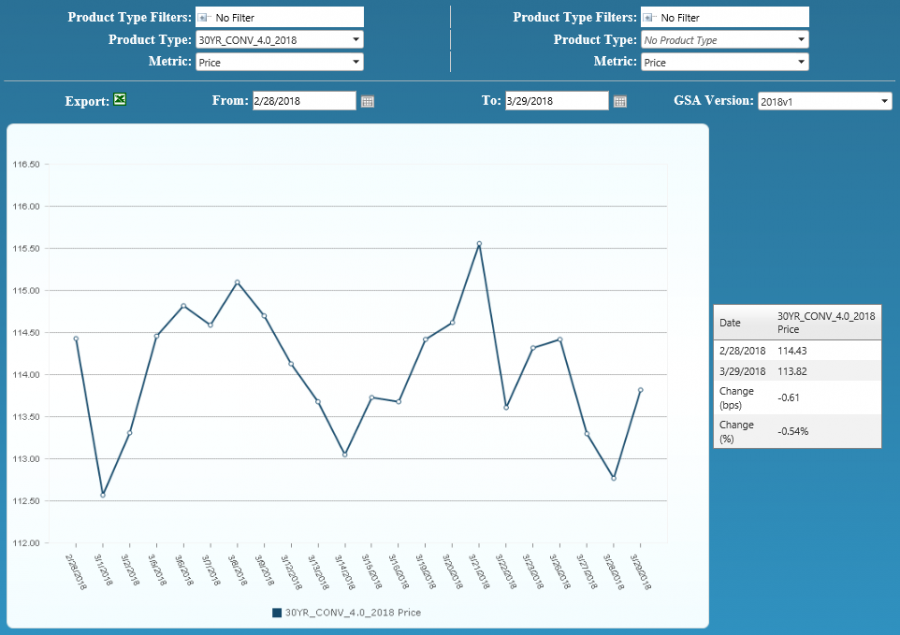
Figure 3: Month-over-Month Conv 30-YR 4.00% 2018 GSA Index Source: MIAC Analytics
 Figure 4: Quarter-over-Quarter Conv 30-YR 4.00% 2018 GSA Index Source: MIAC Analytics
MIAC’s MSR Valuation department provides MSR valuation advisory services to over 200 institutions totaling nearly $2 trillion in residential and commercial MSR valuations every month. Learn about MIAC’s industry-leading valuation, brokerage, and/or GSA benchmarking, and please reach out to your MIAC representative for more information.
Mike Carnes, Managing Director, MSR Valuations, Capital Markets Group
Residential MSR Market Update – April 2018