By Mike Carnes, Managing Director, MSR Valuations Group
MSR Pricing YTD
MIAC Generic Servicing Assets (GSAs™) have seen YTD price increases across all sectors, with a UPB-weighted increase of 30.7%. Across Conventional products, pricing increased substantially more for 30-year than for 15-year. This is due to (a) 30-year primary rates increasing by more than 15-year primary rates, and (b) the higher (i.e., less negative) 15-year OADs (-14.9 vs. -23.7).
Across the 30-year sectors, percentage price increases were the largest for VA (68.5%), followed by FHA (33.6%), and smallest for Conventionals (23.2%). The stronger VA price performance is explained by their more negative starting OADs and their larger spread tightening (1740 to 1189). FHA OAS spread tightening was more in line with Conventionals, so their price performance was more in line with each other. These OASs changes are calibrated to observed price discovery in the bulk market.
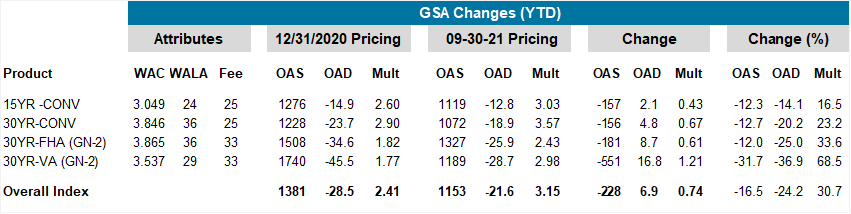
Figure 1: GSA Price Changes Year-to-Date Source: MIAC Analytics™
The relationship between FHA and VA pricing is particularly interesting. At the start of 2021, VA and FHA pricing were very comparable (1.82 vs. 1.77), but by the end of September, VA pricing was a 0.5 multiple higher than FHA!
These pricing dynamics highlight the need for careful modeling of the disparate credit and prepayment behavior of FHA vs. VA loans. Within GNMA-II, VA loans have both advantages (higher average balance, better credit, lower servicing costs, better retention opportunities) and disadvantages (faster prepayments, fewer buyout opportunities, the possibility of VA no-bids, etc.). However, the relationship between these depend upon both loan characteristics and the market environment. Since the start of the year, VA servicing has become less in the money, which reduces its convexity disadvantage relative to FHA. Also, given increasing HPA and the reduction in LTVs, investor concerns about VA no-bids have virtually disappeared. These and other factors have raised the market value of VA vs. FHA.
The duration (OAD) of the GSA universe became substantially less negative since the start of 2021, moving from -28.5 to -21.6, a 24% increase. The increase was largest for VA, which has the worst convexity profile. The OAD impact of the rate backup depends on numerous factors, the most important of which is the moneyness of the cohort at the start of the period. As a result of these OAD changes, servicers who hedge their MSRs need smaller long TBA positions to remain market neutral.
The Quarter-Over-Quarter changes in GSAs are summarized in Figure 2. As is evident from a comparison of Figures 1 and 2, most of the price and OAD movements took place during the first half of the year.
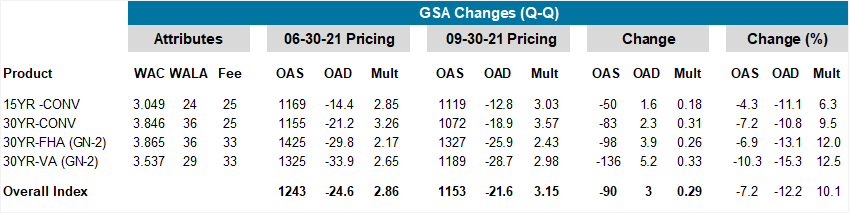
Figure 2: GSA Changes Quarter-over-Quarter Source: MIAC Analytics™
It is worth repeating that MIAC GSA attributes are held fixed over the year to help market participants better understand constant-quality pricing and risk sensitivities. Actual MSR portfolios will have seen even larger duration changes as their average note rates have reset downward. This sensitivity of OADs (and other risk sensitivities) to changes in market conditions is one important reason that MSR Hedge Advisors need to have reliable analytics at their disposal.
For more information regarding MIAC’s Generic Servicing Asset (GSA) MSR Benchmarking tool, please reach out to your MIAC Sales Representative. For more details regarding our credit and prepayment research, please check out our prior publications and webinars and subscribe to our newsletter to receive all future issues of MIAC Perspectives!
Transactions
After a virtually dormant 2020 calendar year, more than $560 billion in residential Fannie Mae, Freddie Mac, and Ginnie Mae servicing has exchanged hands since the start of 2021. This shows that there is more than enough demand in support of an increased number of sellers. In fact, the demand for MSRs has been so great this year that in certain instances we have witnessed the following actions by buyers:
- Waiving due diligence
- Waiving VA indemnifications
- Incorporating higher amount of recapture potential
- Bid prices by depositories sometimes incorporate a higher cross-sell benefit
- Including the expected profitability of EBO buyouts
This increased demand is fully consistent with the OAS tightening across all major sectors we discussed above. It is not atypical for bulk execution prices to assume steepening forward rates along with Agency and Government recapture that respectively average 10% and 20% at an assumed gain-on-sale margin of 1%. As displayed in Figure 3, the CMS curve has steepened considerably since the start of the year.
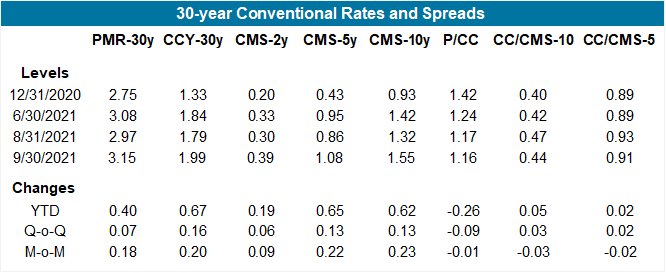
Figure 3: 30-year Conventional Rates and Spreads Source: MIAC Analytics™
Large Agency deals (usually $5 billion UPB and greater) can garner inquiries from 20 or more prospective buyers, with an average of 12 bids per deal. Portfolio size and origination channel can drastically influence who bids and at what level they bid. For example, third party originated deals can execute as much as 10 basis points below a retail offering. Most depositories avoid wholesale and correspondent MSRs and often will not bid and/or not be competitive in their pricing. Conversely, several non-depositories with efficient recapture capabilities don’t discount third party originations to the same extent, based on their ability to aggressively target for recapture themselves.
Smaller deals (less than $5 billion UPB) usually execute at a discount compared to larger offerings, namely because of the reduced economies of scale and reduced competition. Successful buyers of especially smaller offerings have been “keeping it simple”. Many will incorporate deducts into their base offering price and due to rising home price appreciation, some are showing a willingness to wave certain rep and warrants including VA indemnifications.
Sellers of both large and small offerings should ensure that their data is clean and complete. This will improve both liquidity as well as the ultimate execution. Experience has shown that the data transmission process does not always go smoothly. It is imperative to start as early in the sales process as possible. This is especially true of MSR trades that involve a sub-servicer; it is sometimes the case that sub-servicers are missing key fields required for a successful transaction.
MIAC’s MSR Brokerage and Valuation Group has developed a standardized data template and associated ETL software and tools to assist transaction parties with the data transfer process.
Recapture Revisited
While the explicit incorporation of recapture into a “Fair Market Value” concept is not universally accepted by accountants, auditors and other market participants, there is little doubt that the attractive levels being paid for recent MSR transactions reflect some recapture benefit.
Those against direct inclusion will often cite a nearly 20-year old Federal Reserve memo in opposition to inclusion. At the time that memo was written, primary/secondary spreads were not triple digits and portfolio churning was frowned upon due to the high value of MSRs versus gain-on-sale (i.e., GOS) origination margins.
Fast forward to recent times, and the situation has completely reversed itself. GOS margins are often worth more than the MSR, prompting more and more servicers to seek out portfolios with recapture potential. With demand for MSRs at historically high levels, to be competitive in their bid prices, buyers in many instances are required to pay up for recapture-eligible MSRs. With most trades now commanding some amount of recapture, and with the mandate to value those assets at levels that are consistent with benchmark trade prices, servicers are increasingly incorporating this value into their GAAP reporting.
While it is easy to see both the pros and cons of inclusion, explicit direct inclusion of recapture cash flows is the preferred method. Indirect methods of increasing MSR prices (by lowering prepayments or increasing discount rates) have two major problems. First, they will be challenged by auditors and model validation teams. Second, they cannot be relied upon to give accurate risk sensitivities, such as duration (OAD), spread duration (OASD), or convexity (OAC) or stress valuations.
We expect that recapture benefits will diminish but not disappear over time, even in a mildly rising rate scenario. One reason is that the economics of recapture versus the value of servicing has shifted decidedly in favor of recapture – a topic we’ve discussed in prior publications. Another factor is the significant home price appreciation which has occurred over the past several years. We expect that cash out refinancing will continue and will increase as a percentage of total refinances. Data from Freddie Mac’s Refinance Quarterly (which is no longer published) shows that borrowers are willing to do cash out refinances even when the rate on their new loan exceeds the rate on their existing loan. Of course, if rates rise sufficiently, homeowners will extract equity via a (closed-end or revolving) second lien – thus preserving the value of their below-market first lien.
In addition to cash out behavior, conventional borrowers with PMI will find opportunities to refinance, even at a higher rate, to a below 80-LTV loan to jettison their PMI premiums. We see the same story within FHA – where the motivation can be even more pronounced. Rising HPA has pushed lots of borrowers below 80 LTV, which means that borrowers can refinance into a conventional loan without PMI. A quick perusal of originator websites and broker solicitations shows how well known these origination opportunities are understood.
Finally, it is worth mentioning that aggressive recapture also has important implications for passthrough investors. Servicers with highly effective recapture programs will worsen the convexity risk of MBS. Our research shows that, even after adjusting for observable collateral characteristics, prepayment rates vary substantially across servicers. Many dealers show breakouts of prepayment rates by servicer, but they generally do not adjust for collateral characteristics. We will have much more to say about recapture in the future issues of MIAC Perspectives.
Please reach out to your MIAC Sales Representative for information regarding our MSR Brokerage, Valuation, and Hedge Advisory services.
MIAC Perspectives: Residential MSR Market Update – Q3 2021
Author
Mike Carnes, Managing Director, MSR Valuations Group
Mike.Carnes@miacanalytics.com