By Mike Carnes, Managing Director, MSR Valuations Group
MSR Pricing
MSR prices continued their upward climb in Q4 2021. As displayed in Figure 1, MIAC Generic Servicing Assets (hereafter, GSAs™) have seen YTD price increases across all sectors and vintages, with a UPB-weighted increase of 34.4%.
Across Conventional products, pricing increased substantially more for 30-year than for 15-year, in both absolute (0.79 multiple), as well as relative (27.2%) magnitude. This is due to (a) 30-year primary rates increasing substantially more than 15-year primary rates, and (b) the higher (i.e., less negative) 15-year OADs at the start of 2021.
Across the 30-year sectors, percentage price increases were the largest for VA (70.8%), followed by FHA (39.9%), and smallest for Conventional loans (27.2%). The stronger VA price performance is explained by their more negative starting OADs and their more significant spread tightening. In other words, the cumulative price performance can be decomposed into (1) the magnitude of initial risk sensitivities, (2) the movement in the underlying risk factors, and (3) spread tightening. FHA OAS spread tightening was more in line with Conventional loans, so their price performance was closer to one another. These OAS changes are calibrated to observed price discovery in the bulk market on a monthly basis.
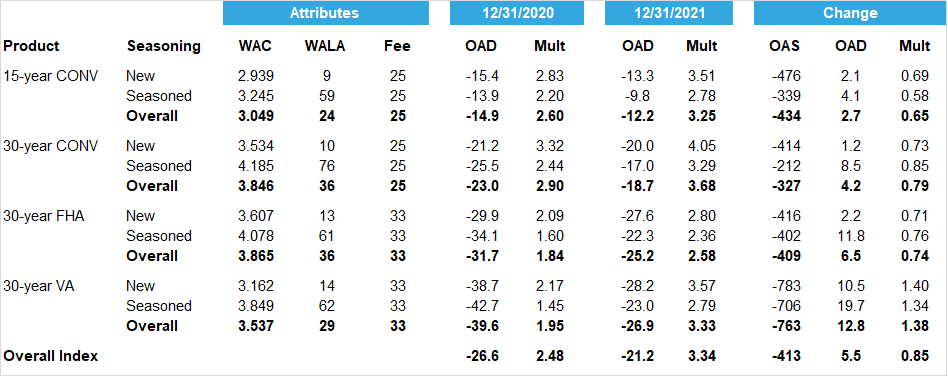
Figure 1: Impact of Rate Changes on GSA™ Cohorts (YOY) Source: MIAC Analytics™
The relationship between FHA and VA pricing is particularly interesting. At the start of the year, VA and FHA pricing was roughly comparable. But by the end of 2021, the VA/FHA pricing difference widened substantially.
These pricing dynamics highlight the need for careful modeling of the disparate credit and prepayment behavior of FHA vs. VA loans. Within GNMA, VA loans have both advantages (e.g., higher average balance, better credit, lower expected servicing costs, better retention opportunities) and disadvantages (e.g., faster prepayments, fewer buyout opportunities, the possibility of VA no-bids, etc.). But the relationship between these depends upon both loan characteristics and the market environment. Since the start of the year, VA servicing has become less In-The-Money (ITM), which reduces its convexity disadvantage relative to FHA. Also, given increasing HPA and the reduction in LTVs, investor concerns about VA no-bids have virtually disappeared. These and other factors have raised the market value of VA relative to FHA.
MSR Durations
The duration (i.e., OAD) of the GSA universe became substantially less negative over 2021, moving from -26.6 to – 21.2, an increase of 5.5 years (or 20% of the initial value). The increase was largest for VA, which had the worst initial convexity profile. The OAD impact of the rate backup depends on numerous factors, the most important of which is the moneyness of the cohort at the start of the period. As a result of these OAD changes, servicers who hedge their MSRs need smaller long TBA positions to remain duration neutral.
The sensitivity of OADs (and other risk sensitivities) to changes in market conditions is one important reason that MSR Hedge Advisors need to have reliable analytics at their disposal. MIAC’s MSR Hedge Advisory team uses our internal CORE™ models. Measuring the price sensitivities of MSR assets is a complex and difficult challenge. Having the MSR Hedge Advisory and Model Development groups within the firm facilitates a continuous feedback loop that simultaneously improves both the hedging recommendations and the underlying models. In contrast, MSR Hedge Advisors that rely on externally developed vendor models can easily overlook model limitations or even implementation problems. Many model limitations are qualitative in nature and may not even be documented.
It is worth repeating that MIAC GSA attributes are held fixed over the course of each calendar year to help market participants better understand constant-quality pricing and risk sensitivities. This is what’s displayed in Figure 1 above. Actual MSR portfolios will have seen even larger shrinkage in duration as their average note rates reset downward.
Vintage-Based Aggregates
Based on feedback from our prior publications, we enhanced Figure 1 to include vintage-based aggregates. Following standard market conventions, these vintages are based on deal age rather than loan age, although the practical difference is small. The details are:
For all four products, the more seasoned vintages have lower pricing multiples. This is because their average remaining balances are generally much smaller than the new production vintages, they are amortizing more quickly, and their prepayments are fully seasoned (i.e., have moved up the aging ramp). However, there are competing forces at play: seasoned vintages also have more accumulated burnout, which slows prepayment speeds. While in principle either effect could dominate, in practice the balance and amortization effects usually prevail.
It is also evident that OADs are less negative for the seasoned aggregates. This is particularly true for the 12/31/2021 pricing date. This is primarily due to burnout and the flattening of the S-curve. This means that, while new production servicing is more valuable, it is also more challenging to hedge.
The Impact of the 2022 GSA Attribute Update
At the start of each calendar year, MIAC updates the GSA cohort attributes based on the most recent data available as of the end of the prior calendar year. We then hold these attributes fixed for the subsequent year (here, 2022). Figure 2 shows the impact of this attribute update. As is evident, WACs declined dramatically due to the massive refinance wave experienced in 2021. WALAs in the aggregate also dropped dramatically, as a result of new originations replacing outstanding seasoned loans. The result of this attribute change, in combination with the higher mortgage refinance rates, was a significant increase in pricing multiples, with 30-year Conventional loans displaying the largest increase.
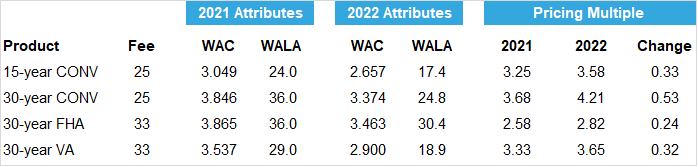
Figure 2: Impact of GSA ™ Attribute Update Source: MIAC Analytics™
For more information regarding MIAC’s Generic Servicing Asset (GSA) MSR Benchmarking tool, please reach out to your MIAC Sales Representative or visit our website. For more details regarding our credit and prepayment research, refer to our prior publications and sign up for our newsletter.
Transaction Volume
Sales and transfers of MSRs will traditionally slow in Q4 and 2021 was no exception. However, at $204.8B in Q4 vs. $231.9B in Q3, the volume and liquidity of MSRs was and still is very impressive.
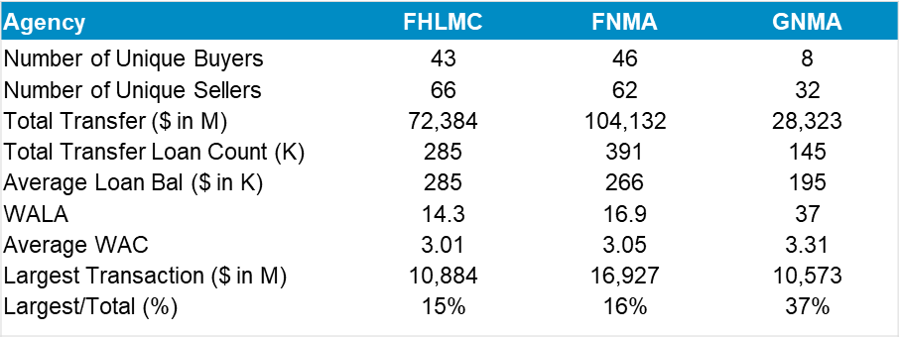
Figure 3: Q4 2021 MSR Transfers Source: MIAC Analytics™

Figure 4: Q3 2021 MSR Transfers Source: MIAC Analytics™
True to form, the average age of all transactions nationally in Q3 and Q4 exceeded 12 months. This is partly because S-Corps and LLCs typically have owners that benefit from the preferential tax treatment of long-term capital gains vs. ordinary income (i.e., certain portions of OMSRs held longer than 12 months). There is typically no reason for a C-Corp to seek capital gains treatment of a bulk sale, because the C-Corp tax rate is the same for capital gains and ordinary income. With origination volume and the resulting margins in decline and roughly $180B of bulk MSRs in the market MTD, 2022 may end up being the most robust year on record for MSR transactions. With MSR multiples higher, and the number of MSRs that are 12+ months seasoned on the rise, increasing numbers of LLCs and S-Corps are considering an MSR sale.
Presuming rates stay on their current upward trajectory, another factor that will impact the amount of MSR sale activity going forward is whether a firm accounts for their MSRs at Lower of Cost or Market (hereafter, LOCOM) or keeps them at Fair Value. Accounting for MSRs at LOCOM can result in less volatility in earnings and lessen the need or desire to hedge potential volatility. This is because any cushion at the homogenous risk-cohort level, while not recordable, can serve as a first line of defense against volatility created by a downward shift in primary mortgage rates. When interest rates rise, firms that account for MSRs at LOCOM are limited in their options when it comes to recognizing any market value increase. Short of a one-time conversion option to Fair Value accounting, the only other way to recognize the upside in value is to sell the MSR. With many firms now sitting on substantial amounts of unrecognizable cushion, the desire to sell can be strong. This is especially true now that out-of-the-money multi-billion-dollar agency deals can fetch pricing multiples of 5x or higher.
After two consecutive years where originations exceeded $4T annually, we expect 2022 originations below $3T. The resulting decline in volume, GOS margins, and recapture potential will cause some to tap into their MSR “Piggy Bank” in order to meet earnings targets. With the most out-of-the-money originations at or nearing their proverbial CPR floor, we are already seeing the beginning signs of CPR flattening. While impossible to precisely time the market, with even smaller agency transactions (less than $1B) sometimes fetching 4x or greater multiples, gambling on future rates moves in a volatile market is becoming increasingly risky. With eight separate firms buying Ginnie Mae servicing in Q4 2021 (and 12 in Q3 2021), even Ginnie Mae MSR offerings, depending on the size, geography, note rate, etc. can trade in the high 3 to low 4 multiple ranges.
MIAC’s MSR Valuation and Brokerage departments provide MSR valuation and advisory services to over 250 institutions, totaling nearly $2T in residential and commercial monthly MSR valuations.
MIAC Perspectives: Residential MSR Market Update – Q4 2021
Author
Mike Carnes, Managing Director, MSR Valuations Group
Mike.Carnes@miacanalytics.com