By Mike Carnes, Managing Director, MSR Valuations Group
GSA Pricing: Month-Over-Month
Over the month of June, primary mortgage rates were mostly flat, while the CMS curve flattened significantly – with 2-year CMS rates backing up 10 BPs and 10-year CMS rates falling 15 BPs. During the same period, the MIAC Generic Servicing Assets (GSAs™) saw price increases across all sectors, with a UPB-weighted increase of 0.85%. However, there was considerable variation across segments: Conventional 30 Year Index (i.e., 30YR_CONV) increased by 0.31%, the Conventional 15 Year Index (i.e., 15YR_CONV) increased by 1.39%, the GNMA-II 30 Year FHA Index (i.e., 30_GNII_FHA) increased by 0.62%, and the GNMA-II 30 Year VA Index (30YR_GNII_VA) increased by 2.58%.
This disparity in price changes reflects differences in cohort-specific OADs, OACs, and spread duration as well as realized differences in OAS.
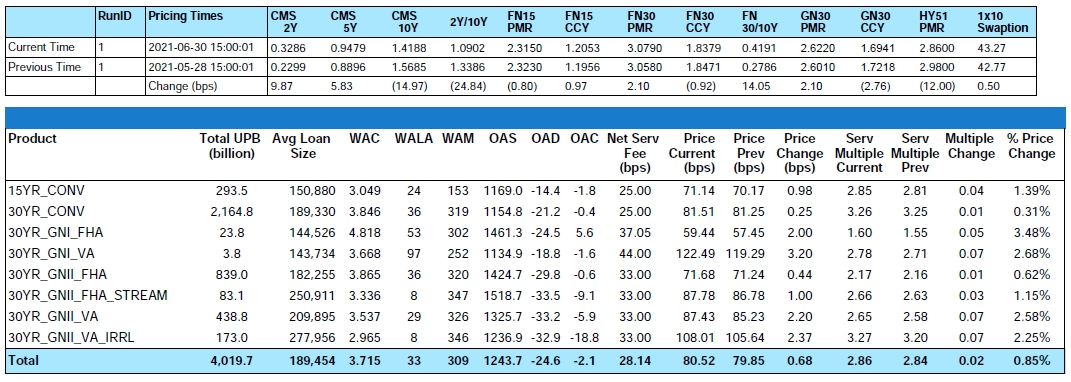
Figure 1: Month-over-Month Pricing Change by Product Source: MIAC Analytics™
GSA Pricing: YTD
The increase in primary mortgage rates since the end of 2020 was thwarted in the 2nd quarter, but with little impact to value. While fear typically sells faster than fame, the good news is that the Q2 correction did little to shake investor appetite, as buyers largely believe that over the remainder of 2021 rates will slowly trend higher and the time for MSR investment is now. Relative to December 31, 2020, primary mortgage rates are now higher by 33 bps versus.
YTD, the overall GSA index increased by 18.6% on a UPB-weighted basis. As is evident from Figure 2 below, there is significant disparity across product segments. For example, within 30-year GNMA-II, VA cohorts appreciated substantially more (49.8) than FHA cohorts (19.4). This underscores the need to distinguish the sub-cohorts within GNMA-II. As we’ve highlighted in recent webinars, the credit and prepay performance of FHA and VA collateral are very different. These behavioral differences are an important distinguishing feature of our CORE™ family of residential models.

Figure 2: Year-to-Date Pricing Change by Product Source: MIAC Analytics™
MIAC’s Generic Servicing Asset (GSA) MSR benchmarking tool is a unique source of collateral-adjusted pricing analytics. Please contact your MIAC Sales Representative for additional information.
Credit and Forbearance Update
While there is Good News
From its peak of 8.5% in early June 2020, the Mortgage Bankers Association’s latest Forbearance and Call Volume Survey revealed that as of June 13, 2021, the total number of loans now in forbearance is 3.93% or roughly 2.0 million homeowners. In the latest report, the share of Fannie Mae and Freddie Mac borrowers in forbearance dropped to 2.05%. The number of Ginnie Mae loans in forbearance is now 5.15% and private-label securities is now 7.98%. The most recent decline of 11 basis points marks the 16th consecutive week of falling forbearance rates and a steady, low level of new requests.
Concerns Remain …
It should be noted that more than 44% of borrowers who exited forbearance since the latest report did so by using a deferral plan. The hope is that borrowers who have lost their jobs will return to work and resume making mortgage payments. However, those that require an interest rate reduction, a term extension, a principal deferral, or some combination thereof, servicer pressure is mounting. This is especially true for firms that service Ginnie Mae loans because Ginnie does not directly reimburse servicers for advances when a loan goes delinquent. Instead, the servicer must buy the loan out of the securitized pool to stop paying the advances, which requires even more cash.
In response to these extended forbearance terms, MIAC’s MSR Valuation Team uses lower cure rates for borrowers with forbearance terms that extend beyond 12 months.
Prepayment Update
While 30-year primary mortgage rates continue to hover around 3%, the share of refinanceable mortgages has nevertheless declined significantly over the past year due to significant refinance activity. Over 40% of the outstanding agency universe at the start of 2020 have since been paid down, either due to refinancing, housing turnover, delinquent loan buyouts, or amortization. Furthermore, new loans securitized since January 2020 have a WAC of around 3.0%, so most are not in-the-money for refinancing.
Still, for 30-year MBS with coupons above 2.5%, the risk of refinance is substantial. Prepays for 2020 vintage 3.0% coupon TBA pools averaged 55 CPR over the past three months. Although older vintages have accumulated a significant amount of burnout, 2015-2017 cohorts are still prepaying above 45 CPR. This is because burnout is a complicated dynamic phenomenon. For example, when rates hover around new lows, previously burned-out cohorts can display renewed refinance sensitivity.
Although 2020 vintage Fannie Mae 2.5 30-year is still prepaying in excess of 30% and Ginnie Mae II 2.5 30-year in excess of 40%, look for refinance activity to eventually slow as mortgage rates rise to the 3.25-3.75% range by year-end. Assuming this happens, don’t underestimate the competition. Whether through ongoing improvements in technology and/or a willingness to make up in market share what they lack in margin, look for sustained price wars as rates back up. In other words, the Primary to Current Coupon spread will narrow as current coupon level rise. Correctly specifying this relationship is key for MSR valuation and especially MSR risk sensitivities and hedging.
MSR Transaction Update
The MSR market was dormant for much of 2020 but has drastically improved over the last several months. Despite the lack of GNMA bulk transfers in the 1st Quarter of 2021, $169 billion of agency MSRs officially changed hands in Q1 2021. Large Agency deals (usually $5 billion or greater) can garner looks from over 20 prospective buyers with an average of 12 bids per deal. Portfolio size and origination channel can drastically influence who bids and at what level they bid. For example, third party originated deals can execute as much as 10 basis points below a retail offering. Most depositories avoid wholesale and correspondent MSRs and often will not bid and/or not be competitive in their pricing.
Conversely, several non-depositories with efficient retention efforts don’t mind third party originated MSRs as much based on their ability to aggressively target for recapture themselves.
Smaller Agency deals (i.e., less than $5 billion UPB) usually execute at a discount compared to larger offerings, because of the reduced economies of scale and reduced competition. Successful buyers of especially smaller offerings have been “keeping it simple”. Many will incorporate deducts into their base offering price and due to rising home price appreciation, some are showing a willing to wave certain rep and warrants including VA indemnifications. Sellers of both large and small offerings should ensure that their data is clean and complete which should improve not only liquidity but also execution price. Sadly, this isn’t always easy – so it is imperative to start as early in the sales process as possible. This is especially true of MSR trades that involve a sub-servicer; it is sometimes the case that sub-servicers are missing key fields required for a successful transaction.
Bulk
Due to changing market conditions, trade levels are a continuously moving target, but recent conventional deals have been executing in the following ranges:
- 4% Note Rate – 2.9 to 3.2 multiple
- 3.75% Note Rate – 3.2 to 3.5 multiple
- 3.50% Note Rate – 3.5 to 3.8 multiple
- 3.25% Note Rate – 3.8 to 4.1 multiple
- 2.75% Note Rate – Mid to even high 4 multiple
These levels correspond to “large” transactions – which generally attract a more significant number of participants. Large transactions are generally defined to be larger than $3 billion UPB for Agency-only collateral and larger than $5 billion UPB for mixed Agency and GNMA collateral. The higher threshold for mixed transactions is due to the increased transactional burden in terms of investor approvals, etc.
Interestingly, the market has now evolved to the point where buyers are regularly incorporating recapture into their bid prices. Even higher note rate offerings can sometimes fetch a premium depending on the collateral. At a hypothetical gain on sale margin of 1% and a lifetime CPR of 15% servicers can expect around 2.5 bps of economic benefit for every 5% of the customers that they recapture – and numerous buyers will pay a premium for this benefit but will often cap the payout at around 10% for Agency and 20-25% for GNMA.
As recapture becomes more efficient and their cash flows grow in economic significance, it is increasingly important that cash flow engines explicitly incorporate these gains on sale margins. The common practice of lowering prepayment speeds to boost market value is wholly inadequate for calculating risk sensitivities and forecasting accurate cash flows.
Large transactions often trade at a premium to Co-Issue. This is due to a combination of:
- Who the buyers are of the larger packages are
- What their economies of scale are and how much recapture they incorporate into their bid
Conversely, acquisition expenses will often find their way into a bulk bid but is rarely noticed on a large trade vs. a smaller trade. Whereas a large trade may fetch 20 or more views, and smaller trades can be half of that amount, or even less, depending on the offering.
GNMA execution levels will depend on whether the pools have been forbearance impacted. Some buyers will pay full price for forbearance impacted MSRs, but most will not. Look to early buyouts to improve the marketability and price of any prospective GNMA MSR offerings. If you’d rather not fund the buyouts with your own funds, there may be firms out there willing to fund some of those buyouts on your behalf. It’s unlikely they’ll look at VA or FHA assets that have been previously modified, but it may be worthwhile to investigate. If it turns out that the assets don’t cure, there is a liquid market for EBOs. “Out-of-the Money” large GNMA deals generally execute in the low to mid 3x range but will vary greatly on age, service fee, average balance, geography, and VA concentration.
Co-Issue
Co-Issue multiples are finally back to pre-COVID levels! In March/April of 2020, the co-issue market pretty much dissolved. As an example, buyers set their par rates to 1.75% and wouldn’t pay for anything that was 100 bps or more outside of their defined par rate. After key announcements from the FHFA it seemed that buyers were raising their prices every week. Today, Co-Issue can be the outright best execution. This was clearly the case in the 4th Quarter of 2020 when $83 billion was sold via co-issue. More recently, aggregator pricing has improved and is reducing the amount of co-issue sold, but even now co-issue tends to be the best execution about 20% of the time.
What does that mean for prices? Agency Co-Issue multiples are in the low 4x range before any adjustments. FHA Co-Issue multiples at 44 bps are in the low 3x range and at 19 bps are in the high 2x multiple range before any adjustments. As a result of faster VA prepay speeds, on average VA generally trades 10-12 bps below FHA. To be eligible for a GNMA Security, a borrower must make 6 consecutive payments since their last refinance. However, we often observe actual VA VPRs as high as 70-85 in the 7-10 WALA range. These disparate age profiles underscore the need for fully separate prepayment models for VA and FHA collateral. For additional details, request access to our first installment of our CORE™ Webinar series.
When benchmarking Co-Issue with Bulk, it is important to compare fully adjusted pricing on the former. Base prices need to be adjusted for state, loans size, remittance type, FICO, LTV and % of TPO.
In the best-execution world that we all live in, Co-Issue volume will rise and fall with how aggressive the aggregator pricing is, but it helps to have options especially with buyers that have no minimum delivery requirement. Please reach out to your MIAC Sales Representative to get more information about establishing your firm on Fannie Mae’s Servicing Market Place or Freddie Mac’s Xchange.
MIAC Perspectives: Residential MSR Market Update – July 2021
Author
Mike Carnes, Managing Director, MSR Valuations Group
Mike.Carnes@miacanalytics.com