By Dick Kazarian, Managing Director, Borrower Analytics Group
MIAC’s quarterly Perspectives will cover themes such as housing markets, mortgage rates and spreads, rates and volatility markets, residential originations and securitizations, credit and prepayments.
Mortgage Rates and Spreads
Figure 1 displays a snapshot of primary and secondary 30-year conventional mortgage rates since the start of the year. Year to date, primary rates have backed up 40 bps while secondary rates have increased 67 bps. This means that the primary/secondary spread narrowed by 26 bps. This primary/secondary (hereafter, P/CC) spread is driven by numerous factors, including g-fees, servicing costs, origination costs, and numerous other factors. Many of these factors change slowly over time and only impact the long run behavior of the P/CC spread.
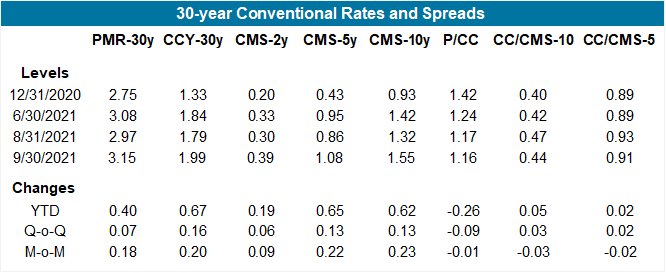
Figure 1: 30-year Conventional Rates and Spreads Source: MIAC Analytics™
The biggest driver of short run dynamics in the P/CC spread is the ability of originators to exercise market power. When rates rally sharply, the demand for refinances increases. Since capacity is fixed in the short run, originators can adjust primary rates to ration excess demand. This results in a widening of the P/CC spread, as well an increase in gain-on-sale margins; the larger the newly eligible refinance universe, the greater is their pricing power. Over time, as the outstanding mortgage universe gets refinanced and capacity constraints lessen, the P/CC spread will narrow to an equilibrium level driven primarily by the long-run factors. This is what we have observed since the start of 2021.
It is also evident that the secondary/swap (hereafter, CC/CMS) spread displayed more stability over this time period. This spread increased a mere 5 bps YTD in 30-years. Furthermore, there nothing special about the behavior of these spreads in 2021. Over most historical periods, the CC/CMS spread is in general much less volatile than the P/CC spread.It is also driven by a different set of factors, which explains why the CC/CMS spread increased YTD while the P/CC spread decreased. These explanatory factors include implied volatility, the slope of the swap curve, generic refinance efficiency, Fed purchases, and CMO activity. As one example, an increase in refinance efficiency – making mortgages more callable will widen the CC/CMS spread. Figure 1 also shows that most of these YTD changes occurred during the first half of 2021.
These same patterns are observed for the 15-year conventional market, as shown in Figure 2. In fact, the compression of the P/CC spread for the 15-year is even more dramatic (dropping 37 bps vs. 26 bps). This is because the 15-year market is primarily a refinance market, whereas the 30-year market is a blend of purchase and refinance originations. And it’s the sudden excess demand in the refinance market that gives originators their pricing power – purchase activity is not that volatile. Note also that the CMS curve experienced a backup steepener since the start of the year: the CMS-10y backed up 62 bps vs. 19 bps for the CMS-2y. This slope of the CMS curve reflects market expectations about future short rates, which are driven in large part by inflation. We display the complete time series of month-end rates and spreads since the start of the year in Figures 3 and 4.
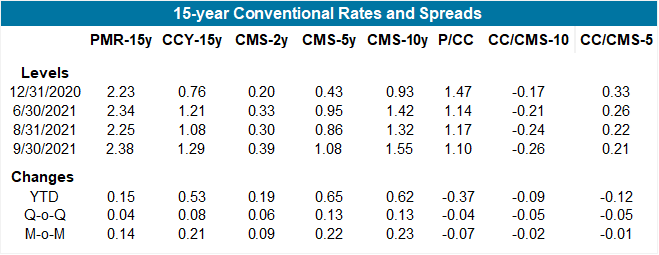
Figure 2: 15-year Conventional Rates and Spreads Source: MIAC Analytics™
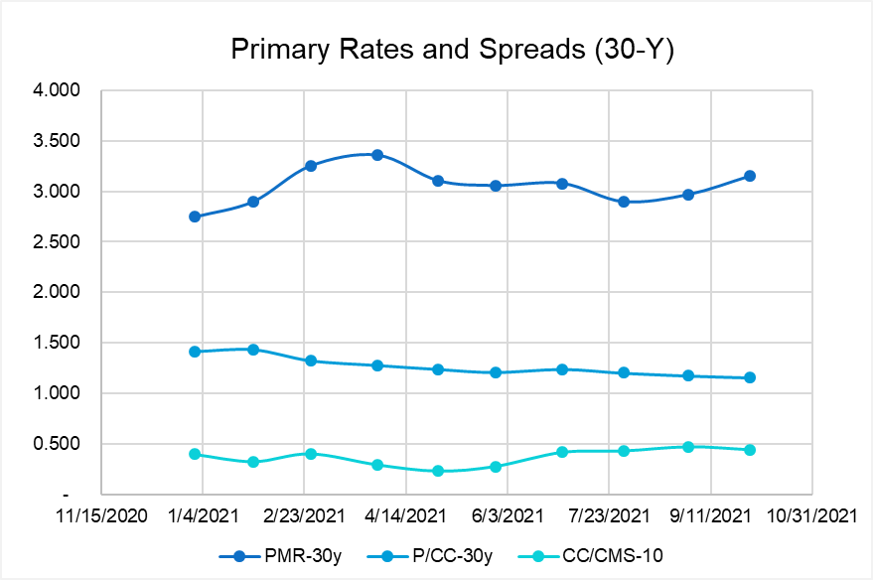
Figure 3: 30-year Primary Rates and Spreads Source: MIAC Analytics™
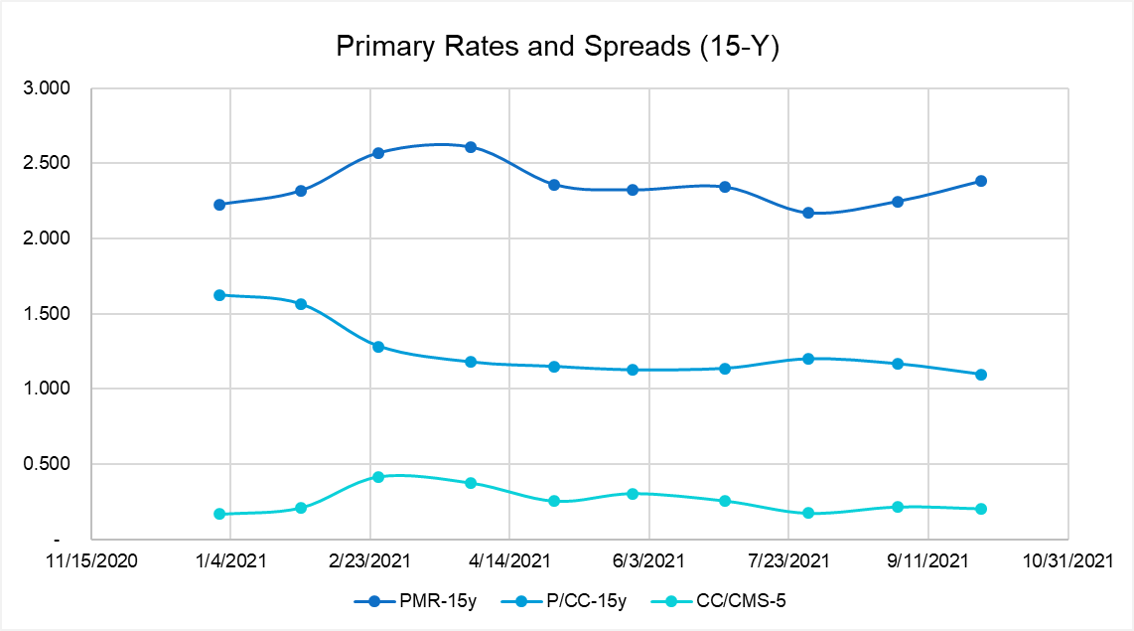
Figure 4: 15-year Primary Rates and Spreads Source: MIAC Analytics™
Collectively, these dynamics underscore the need for careful independent modeling of the P/CC and the CC/CMS spreads (i.e. using separate modeling frameworks). The evolution of both spreads, in either a static or OAS framework, will have a significant impact on valuations, risk sensitivities, and stress valuations. We will save a more detailed discussion of these dynamics for an upcoming edition of MIAC Perspectives.
Improved Market Transparency with MIAC Data Products
In order to track and develop models for rates and spreads, it is necessary to have high quality data. The secondary rate computation entails two ingredients. The first is accurate TBA pricing. Although the TBA market is generally quite liquid for coupons close to parity and for the first couple of settlement months, careful processing of the TRACE data can result in improved price discovery relative to other benchmarks. MIAC has developed an IOSCO-compliant TBA Price Fixing methodology. Our analysis has found that this methodology provides more accurate end of day pricing than alternative approaches. A second component of accurate secondary rate computations is the interpolation/extrapolation methodology. This methodology is particularly relevant when the entire liquid TBA stack is at a premium, which has been the case for much of the past few years.
Outstanding Mortgage Universe
Just over two years ago, 88% of outstanding conventional 30-year mortgages were at least 50 bps “in-the-money” and at a greater risk for refinance. As of today, the share of borrowers that are 50 bps or more ITM is now 36%. This decline occurred as rates have more or less moved sideways over the last two years, giving borrowers ample time to refinance into a lower rate. Two years ago, 1.5% and 2.0% coupon 30-year UMBS pools were unheard of, but now comprise over 35% of total outstanding conventional 30-year MBS.
This coupon re-setting of the mortgage universe has also resulted in a lengthening of the duration of the MBS Index, which has been noted by both dealers and index providers.
Forbearance and Modifications
From its peak of 8.5% (4.3 million homeowners) in early June 2020, the Mortgage Bankers Association’s latest Forbearance and Call Volume Survey revealed that, as of October 10, 2021, the total number of loans now in forbearance is 2.28% or roughly 1.1 million homeowners. The share of Fannie Mae and Freddie Mac borrowers in forbearance dropped to 1.05%. The number of Ginnie Mae loans in forbearance is now 2.77%, and in private-label securities 5.34%.
By stage, 14.8% of total loans in forbearance are in initial forbearance, while 75.5% are in a forbearance extension. The remaining 9.7% are forbearance re-entries. Cumulative forbearance exits for the period from June 1, 2020, through September 19, 2021 are broken down as follows:
- 28.9% resulted in a loan deferral/partial claim
- 20.8% represented borrowers who continued to make their monthly payments during their forbearance period
- 16.7% represented borrowers who did not make all their monthly payments and exited forbearance without a loss mitigation plan in place yet
- 12.9% resulted in a loan modification or trial loan modification
- 12.2% resulted in reinstatements, in which past-due amounts are paid back when exiting forbearance
- 7.1% resulted in loans paid off through either a refinance or by selling the home
- 1.4% resulted in repayment plans, short sales, deed-in-lieu or other reasons
According to HUD Press Release No. 21-160, forbearance agreements may be extended out as far as October 2022 in certain circumstances. The structure of these forbearances is intended to help transition borrowers into repayment. However, data from the MBA points to the fact that the longer borrowers stay in forbearance, the less likely they are to become current.
According to Michael Fratantoni, Chief Economist at the Mortgage Bankers Association, “Borrowers who are exiting forbearance now are likely to have been in relief for over a year, with almost 60% of borrowers in forbearance extensions of longer than 12 months. These borrowers may face more challenges getting back to making regular payments.”
MIAC has been executing EBO sales with our clients at par to premium pricing, allowing owners to sell away market, performance and interest risk. Transacting in this market saves owners the expense of servicing fees and potentially unlimited performance risk.
GNMA to Allow 40-year Amortization Term Mods
Starting later this year, Ginnie Mae will allow pooling of modified loans with amortization terms up to 480 months. This opens up additional modification opportunities to keep borrowers in their homes, particularly if rates rise, which is a priority for HUD (according to Senior Advisor Alanna McCargo). More importantly, this allows for much better execution for sellers of these loans that may have been stuck on the balance sheet.
How does amortization term impact credit performance? There is overwhelming evidence that 15-year amortization term loans have much better credit performance than 30-year amortization term loans, holding constant all other observable factors. This relationship holds across all sectors: Agency, Non-Agency, and Government, although there is very little 15-year in FHA/VA. However, we need to be careful with the casual interpretation: it is not true that if a given borrower takes a shorter amortization loan then their credit risk will necessarily decline, since their required payment (and hence DTI) will increase. Rather, the evidence suggests that lower credit borrowers will generally self-select into affordability products. We saw this with the run-up to the global financial crisis (GFC) with features that lowered the initial payment such as pay option arms, teaser rates, IOs, balloons, and prepay penalties.
What empirical evidence exists for 40-year amortization loans? During the 2004-2007 period, 40-year amortization subprime loans became increasingly common, and their credit performance was 10-20% worse than 30-year loans (adjusting for all other characteristics). However, these loans disappeared as the GFC unfolded, so there is no recent empirical evidence. Until additional performance data becomes available, we believe that the historical experience is a reasonable benchmark and will deploy that in our CORE™ Models.
Prepayment Changes from our MIMs Survey
The YTD changes in our MIMs Prepayment Survey for key coupon aggregates are summarized in Figure 5. These prepayments are median average life equivalent (ALE) prepayment speeds inclusive of buyouts. For each coupon aggregate, we calculate the median over all contributors for each vintage cohort and then calculate a UPB-weighted average. Several key themes are apparent from Figure 5. First, the decline in conventional 15-year prepayments is much smaller than the decline in 30-year speeds. This is mostly because the increase in the respective primary rate was smaller (15 vs. 40 bps). In addition, 15-year prepays have somewhat flatter s-curves. Second, for 30-years, both conventional and GNMA-II, the “cuspier” coupons had the largest prepayment drops. The higher coupons (4.0 and 4.5) have already accumulated significant burnout and are therefore less sensitive to rate changes. A final observation is that the higher coupon GNMA-II generally have higher prepays than their conventional counterparts. This is mostly due to higher buyouts (mostly within FHA), slower prepayment burnout accumulation, and streamlined refinance options within both FHA and VA.
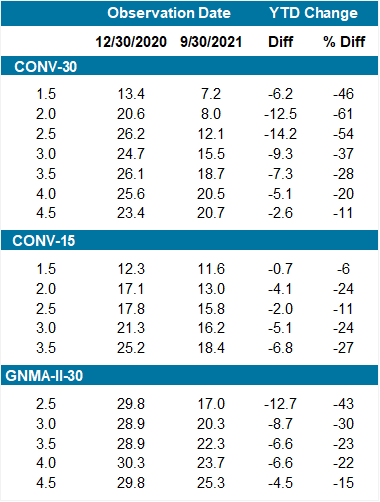
Figure 5: MIMs Prepayment Survey Changes (YTD) Source: MIAC Analytics™
MIMs Contributor Dispersion
Although not displayed in Figure 5, there is considerable dispersion across survey contributors for numerous major cohorts. That is, the difference across contributors for the same cohort can be substantial, often exceeding 25% of the median value. For the cohorts near par, these differences are partly due to disagreements about how much equity extraction borrowers will engage in. While no researchers expect a return to the significant amounts of cashout refinancing that occurred prior to the start of the GFC, there is a no obvious comparable historical period that one can use to benchmark future cashout prepayments. In addition to the expected equity extraction amount, there is also disagreement about the equity extraction mechanism. Should rates rise sufficiently, we expect to see borrowers using second liens, either closed-end or HELOC, rather than cashout refinances of their first liens. Another significant source of cross-contributor variation is GNMA buyouts, especially for the non-bank servicers.
MIAC’s Mortgage Industry Medians™ (MIMs) provides consensus, long-term prepayment projections based upon a survey of leading industry contributors on a semi-monthly basis. This survey can help mitigate the ambiguity and uncertainty surrounding prepayment assumptions within MBS and MSR Analytics. The dispersion across contributors can help market participants and their regulators assess model uncertainty. New contributors are welcome and receive a free subscription. For more information regarding our MIMs survey, please contact Dick Kazarian.
MIAC Perspectives: Update on Market Rates and Prepayments
Author
Dick Kazarian, Managing Director, Borrower Analytics Group
Dick.Kazarian@miacanalytics.com