By Dick Kazarian, Managing Director, Borrower Analytics Group
This article takes a closer look at the credit risk of FHA purchase loans within our CORE™ Residential Model Suite. We cover the following topics:
• Core Model Framework
• The Importance of a Competing Risk Framework
• Segmentations within the Government-insured sector
• Why focus on FHA purchase loans?
• Origination trends
• What drives credit performance?
Core Model Framework
Figure 1 shows the transition model framework used by the latest version of our CORE Residential Model Suite. We track each loan’s contractual delinquency status from current (C) through serious delinquency (D120+) and REO. Moreover, we distinguish between loans that are always current or clean current (AC) and loans that are dirty current or re-performing (DC).
We use the notation “A->B” to denote a transition from status A to status B. For example, AC->D30 represents a migration from always current to D30. Similarly, D60->DC represents a self-cure from D60 back to current (i.e., the borrower made three payments over the month). Note that the ending status will be dirty current.Once a loan has migrated away from AC, it can never return.
We also track the time-in-status (i.e., months-in-state or MIS) in our framework. For clarity, we do not display MIS explicitly in Figure 1. MIS is a loan attribute provided on a data tape as of the launch date of the analysis but is propagated within the forward simulation using a recursive algorithm. This very granular description of a loan’s delinquency status and MIS is critical for accurate valuation of seasoned whole loans (especially re-performing and non-performing loans), as well for MSRs.
It is well established that the delinquency status of a loan is a vital driver of subsequent credit and prepayment behavior. For example, a loan that is D90 (i.e., 3 months past due) is far more likely to eventually default than is a loan that is D30. This understanding is why transition-based approaches to mortgage behavior have become ubiquitous in mortgage analytics. Less well appreciated is the importance of MIS on credit behavior even after controlling for a loan’s delinquency status. For example, D30 loans which have persisted in D30 for many months (rolling D30s) are much more likely to remain in D30 than are otherwise equivalent D30 loans that just arrived from another status. Stated another way, a loan’s behavior depends on both the status as of the start of the month, as well as its payment history.
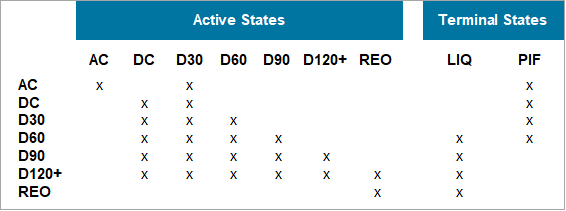
Figure 1: CORE ™ Model Framework Source: MIAC Analytics™
We refer to the probability transitions within active states as credit transitions, and the transitions into prepayment (PIF) as the prepayment model. These probability transitions are estimated as functions of explanatory factors using the best available loan-level commercial datasets. For Government-insured loans covered below, we use the GNMA disclosures that have detailed history back to 2013.
Segmentations within the Government-insured Sector
The Government-insured sector consists primarily of FHA, VA, and RHS/USDA loans that are deliverable into GNMA securities. As we have noted in prior publications and webinars, it is important to recognize that these GNMA sub-sectors have very disparate behavior. For example, FHA loans have much worse credit than VA loans, even after controlling for their (higher risk) attributes. Similarly, VA loans have much higher prepayment speeds, especially when in-the-money (ITM) and at loan ages between 6-10 months.
This disparate credit and prepayment behavior must be addressed at the model development stage by segmenting the estimations. That is, the analyst needs to specify and estimate entirely separate models for the different sub-sectors. Although this is time consuming from both model development and model deployment perspectives, it is a crucial step for accurate projections of future credit and prepayment behavior. To cite one example of what can go wrong, note that the FHA fraction of GNMA pools tends to grow as the pool seasons, owing to the faster prepays on the VA loans. This is especially true for vintages that have experienced significant refinance episodes, such as the 2017-2019 vintages. If this disparate credit behavior is ignored, the analyst will consistently under-predict credit losses for seasoned GNMAs.
Although segmentation by sub-sector is important, it does not go far enough. Our research has shown that additional product-level segmentation (i.e., within a sub-sector) is also necessary. Specifically, we find that previously modified and streamlined refinances must be estimated separately from purchase and traditional refinances. In addition, even within a product and sub-sector group, the behavior of always current and re-performing (or dirty current) also requires separate estimations. We will revisit these highly relevant topics (for both FHA and VA) in future MIAC publications.
Why focus on FHA purchase loans?
For the remainder of this article, we will focus on credit risk in FHA purchase loans. This product segment deserves consideration for the following reasons:
• Purchase loans will dominate the origination landscape for the foreseeable future
• No FHA credit attributes are improving, and DTIs are worsening
• There are “hidden” credit risk factors that market participants should be aware of
• The DPA share could increase if rates continue to rise
Origination Trends
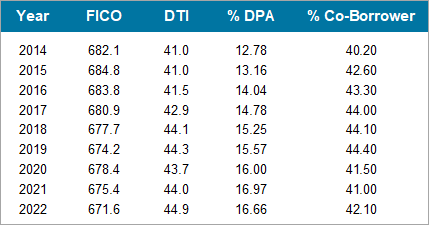
Figure 2: FHA Purchase Loan Borrower Statistics by Origination Year Source: EMBS GNMA Loan Data
Before turning our attention to credit performance, we examine FHA purchase origination trends. Figure 2 displays selected (UPB-weighted) attributes of FHA purchase originations from 2014 through YTD 2022. Several conclusions are apparent. First, FICO scores have gotten marginally worse. Our research shows that a 10-point drop in FICO results in a 10-15% increase in credit risk (depending upon the value of other attributes). Second, back-end DTIs have increased steadily over this period, and average DTIs now exceed what was once considered the Non-QM “threshold” value of 43. Third, the fraction of loans with down payment assistance (DPA) has also increased. Fourth, the % of loans with a co-borrower have remained steady over this time period. Although we cannot be dogmatic about future FICO or co-borrower trends, we believe that affordability concerns alone will push both DTIs and the DPA share higher over the next few years, particularly if primary rates continue their upward ascent.
What Drives Credit Performance?
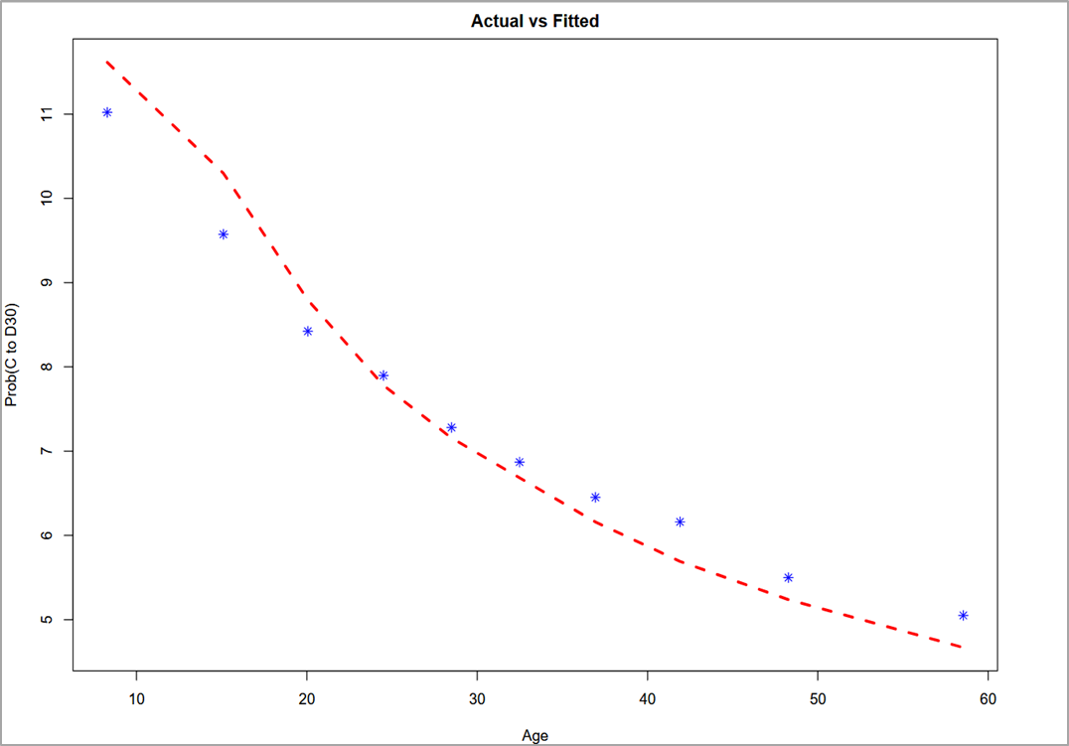
We now turn to credit performance. Our FHA purchase credit model contains most of the same attributes as our Agency credit model described in our 2022 Spring MIAC Perspectives. These characteristics include borrower attributes (e.g., DTI and FICO), loan and property attributes (e.g., CLTV-MTM) and changes in unemployment. However, the magnitude of these effects differ. For example, the distinction between always current (AC) and dirty current (DC) loans is larger in FHA than in Agency. Figure 3 shows the importance of payment history on current to D30 migrations (C->D30). Panel A displays always current to D30 (AC->D30) versus loan age, while Panel B displays dirty current to D30 (DC->D30).
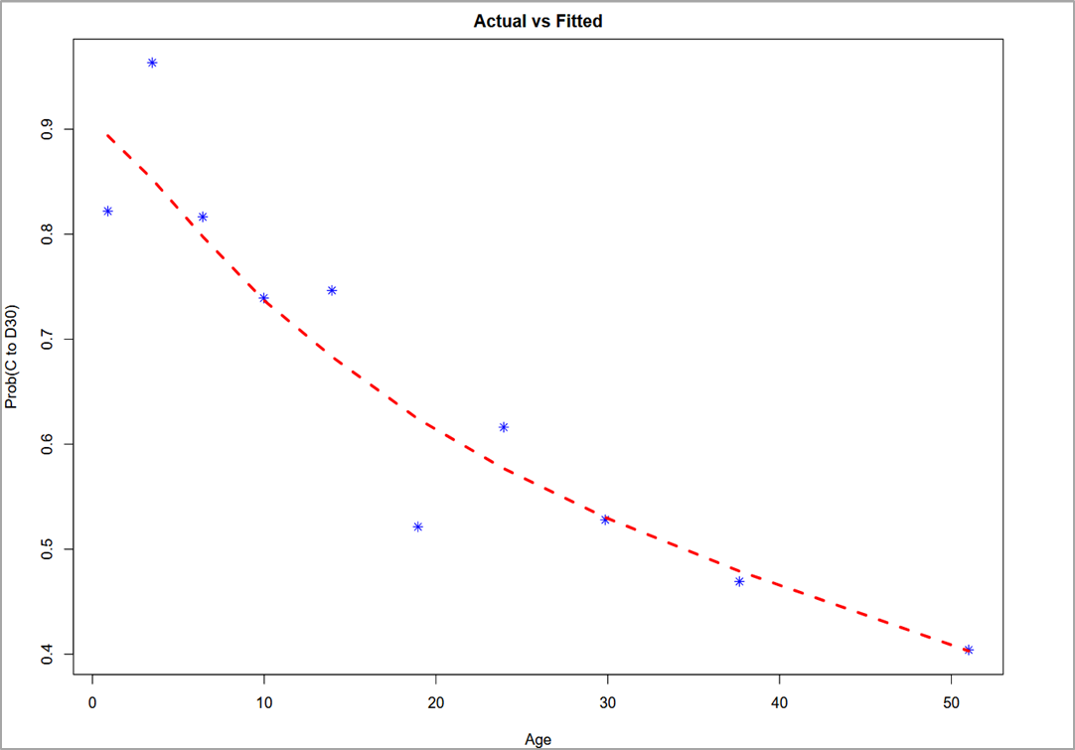
The most obvious conclusion from comparing Panel A and Panel B is that DC->D30 rates are 6-10 times higher than AC->D30 rates. Although this does not necessarily mean that a segmented estimation is needed, further investigation shows that, in fact, a segmented approach is required. The reasoning is the same as for Agency loans, which we covered in detail in our 2022 Spring MIAC Perspectives. The impact of months-in-state (MIS) on DC->D30 migration rates is displayed in Figure 4. As is evident, the impact of MIS on these transitions is highly non-linear. At low levels of MIS, DC->D30 monthly transition rates are in the 12-20% range. After MIS of about 24 months, DC->D30 rates drop to 2-3%. Note that our model fits this non-linear relationship very well. Finally, pricing in the re-performing (RPL) market corroborates these relationships.
(From left to right)
Figure 3: Panel A: AC->D30 Transitions (FHA Purchase Loans) Source: MIAC Analytics™
Figure 3: Panel B: DC->D30 Transitions (FHA Purchase Loans) Source: MIAC Analytics™
Down Payment Assistance (DPA) is a recurring feature of FHA purchase loans. As displayed in Figure 2 above, approximately 12-18% of loans have DPA. Loans with DPA perform significantly worse than loans without DPA, as shown in Figure 5. To illustrate the effect of DPA on AC->D30 migrations, we estimated a common credit model that excluded DPA as an explanatory factor, but included all other relevant factors (e.g., DTI, FICO, Age, CLTV-MTM, etc.) We then split the sample of actuals and fitted into DPA and non-DPA. As is evident, DPA loans have worse credit performance, even after adjusting for all other included variables, particularly at FICOs below 700. Note also that their expected behavior is also marginally worse.
There are two reasons for the higher credit risk of DPA loans. First, there is a direct effect. DPA loans have higher mark-to-market combined LTV (CLTV-MTM). These DPA programs often require a second lien, which reduces the borrower’s true net equity in the property. Our internal research, as well as an abundance of external research, confirms that borrowers make decisions based on their combined indebtedness (i.e., CLTV-MTM), rather than the first lien LTV alone. Although this is a factor in DPAs, the second lien balances are usually small relative to the first lien. In contrast, just prior to the GFC, simultaneous piggyback seconds in the form of 80-20 loans were commonplace in the Non-Agency sector. Properly accounting for second liens on first lien behavior has been a mainstay of MIAC credit models since their inception. Our Core models account for second liens that are active as of the launch date of the analysis, whether simultaneous seconds or subsequent seconds. We believe this issue will grow in importance along with the growth in all second lien originations, including HELOCs. In addition, given the affordability issues confronting many first-time homebuyers, the relative underperformance of DPA loans will likely increase.
The availability of DPA programs has a second, indirect effect. Higher-risk borrowers who are more affordability or down-payment constrained are more likely to self-select into these programs. This indirect effect reinforces the direct effect described above.
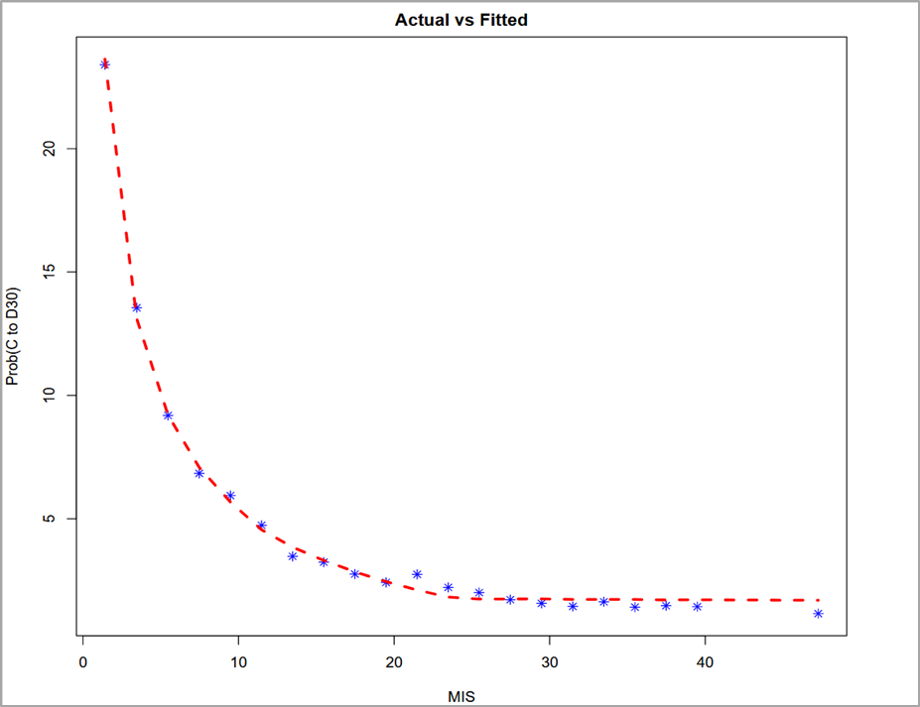
Figure 4: Impact of MIS on Credit for FHA DC Source: MIAC Analytics™
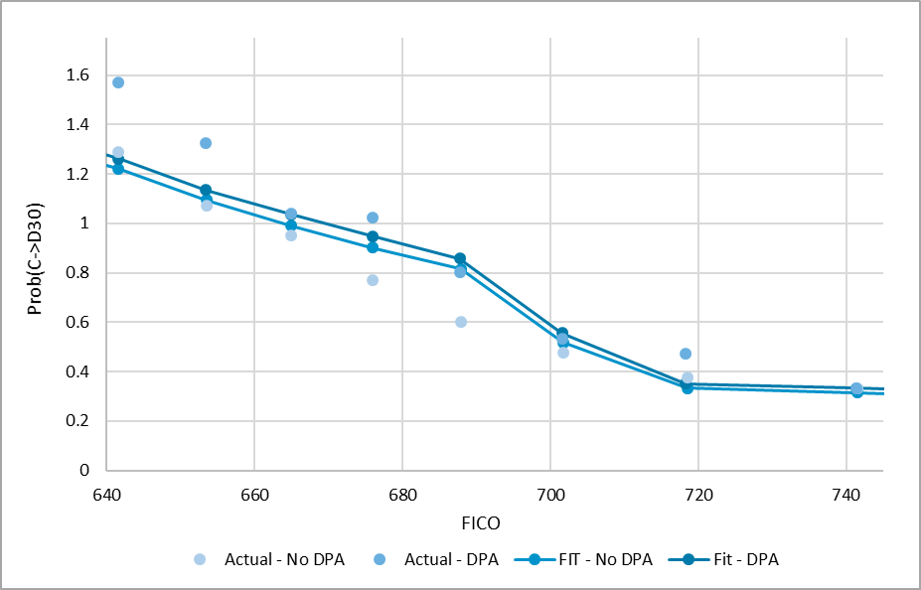
Figure 5: AC->D30 FICO Fit and Actual by DPA Status Source: MIAC Analytics™
Co-Borrower Flag
The existence of a co-borrower flag in the GNMA data is analogous to the DPA flag covered above. The data is readily available in our estimation dataset, the effect is large, and it is not frequently discussed or analyzed by market participants. And like the DPA effect described above, MIAC’s software will accommodate this data whenever it is provided to us by our clients. The effect of a co-borrower is displayed in Figure 6. We quantified the impact of co-borrower in the same way the DPA flag was quantified above. As is evident, the impact of co-borrower is even larger than the effect of DPA and is largest in the lower FICO ranges.
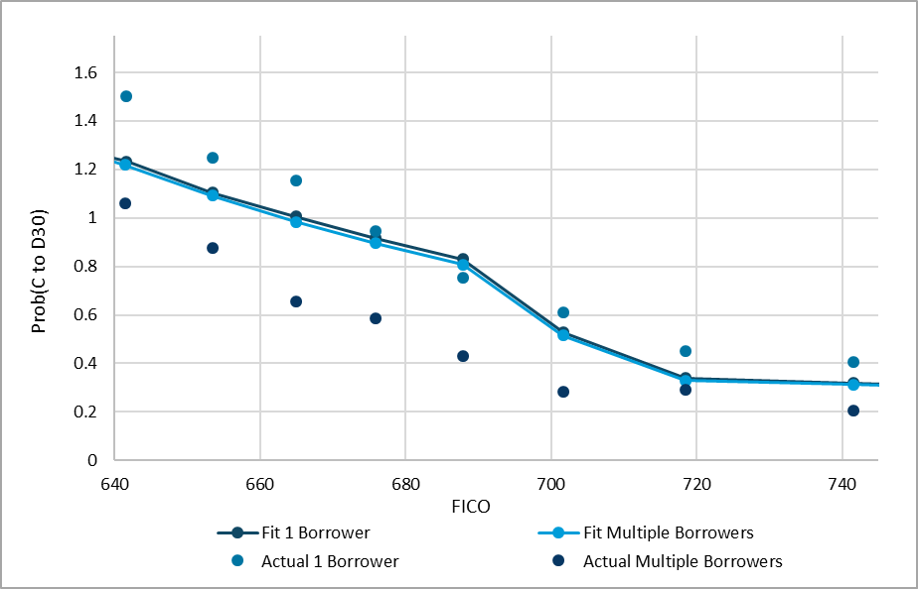
Figure 6: Fitted and Actual AC->D30 Transitions by FICO (With and Without Co-Borrower) Source: MIAC Internal Calculations
Conclusion
Credit trends in residential mortgages have so far been benign. We believe that a combination of high LTV lending, weakening underwriting (i.e., higher DTIs and lower FICOs), declining home prices, rising unemployment, and rising primary rates mean more credit losses and increased advancing obligations for MSR holders in the months ahead. Should these scenarios unfold as many expect, there is little doubt that the FHA sector will experience the largest deterioration in credit performance.
MIAC Perspectives: CORE Insights: Are FHA Purchase Loans a Lurking Credit Risk?
Author
Dick Kazarian, Managing Director, Borrower Analytics Group
Dick.Kazarian@miacanalytics.com
View MIAC Perspectives – Fall 2022 Issue