The FINRA Rule 4210, which establishes margin requirements for Covered Agency Transactions, including TBAs, has been a concern of secondary hedgers since the SEC’s approval of it back in June of 2016. After several delays to the effective implementation date, it looks like this latest date of June 25, 2018 just might stick. How does this specifically affect mortgage pipeline hedging and is there anything you should do in the upcoming months to prepare?
Prior to 4210, many TBA brokers had already implemented a minimum mark-to-market threshold for margin calls and these thresholds typically vary from $100K to $1MM. Starting June 25, 2018, maximum thresholds will reset to $250K. This maximum threshold rule means that a secondary manager will need to pay significantly more attention to MTM management of unsettled trade positions. After the volatile market, we experienced this past week, it’s not difficult to imagine how quickly the market could move by one point on $25MM of outstanding TBAs to surpass the threshold limit.
It’s important to note that some dealers will be exempt from the rule, such as bank dealers, who are regulated by the OCC. Take note of your existing counterparty lines and learn how things may be changing specifically for each one.
Additionally, secondary managers may be able to reduce MTM exposure by utilizing investor assignment of trade executions. There are the usual Direct/AOT contracts that one can execute into where a seller designates a specific TBA trade and price to assign to a pool of loans of like security and coupon. There are also some investors out there who will execute AOT along with bulk bid executions if the pool size is large enough, which would similarly allow sellers to transfer that TBA trade over to the investor, rather than pairing it out at current market. Ask your MIAC account manager if your investors offer these options to reduce MTM exposure on your position.
TBA Liquidity
For a secondary marketing hedger, the underlying liquidity of the TBA market is essential to understand. Some of the dynamics of the TBA market evolve over time. Here are some relevant observations for TBA hedgers.
The GNMA I market liquidity can now be officially declared as “Dead”. For the calendar year 2017, FINRA reports that GNMA I accounted for only 1.2% of total Agency Trading volume (Figure 1). And not surprisingly, FNMA accounted for 67.8% or 8.2 times as much trading activity as Freddie Mac for the year (Figure 1).
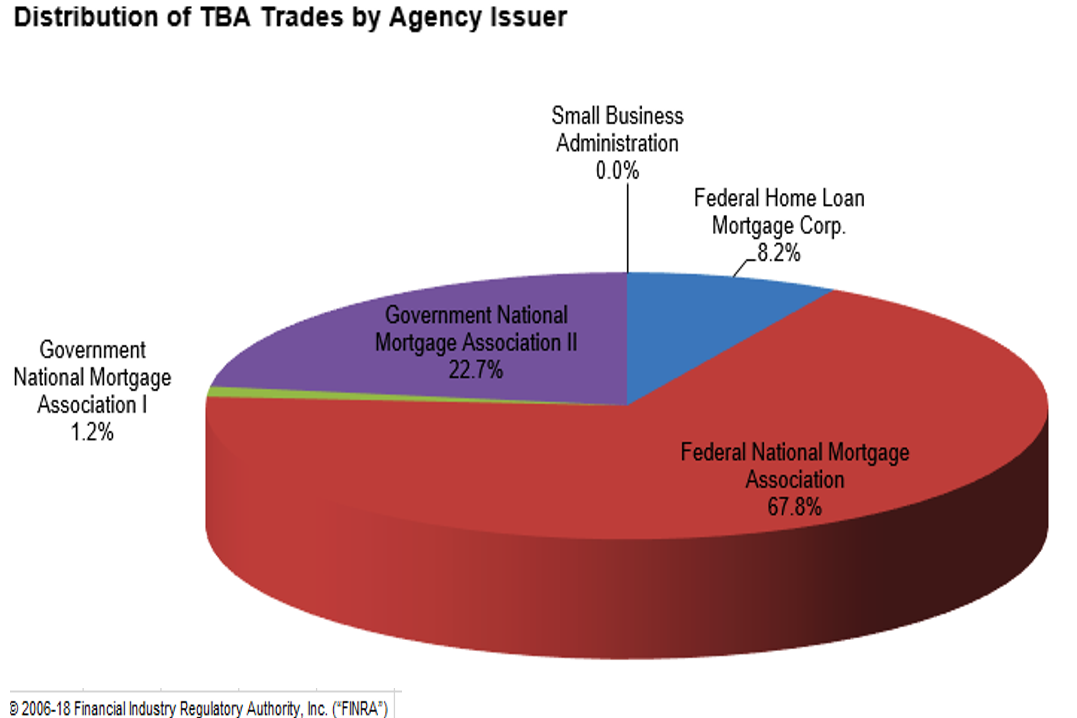
Figure 1: Distribution of TBA Trades by Agency Issuer Source: FINRA
Most secondary market hedgers put on additional hedges late in the trading day once they have definitive information about their daily closed loans and new locks. However, the most liquid fixed income UST Futures and Swap markets have a significant decline in trading volumes after 3 pm when the exchanges close. Does this reduction in liquidity in the “rates” markets negatively impact the TBA market for mortgage originators?
According to the FINRA trade data (Figure 2), trading frequency significantly increases from 4 pm to 5 pm. The mortgage bankers hedging their new originations still have a lot of liquidity in the market for clients adding their final hedge coverage between 4 pm to 5 pm every day.
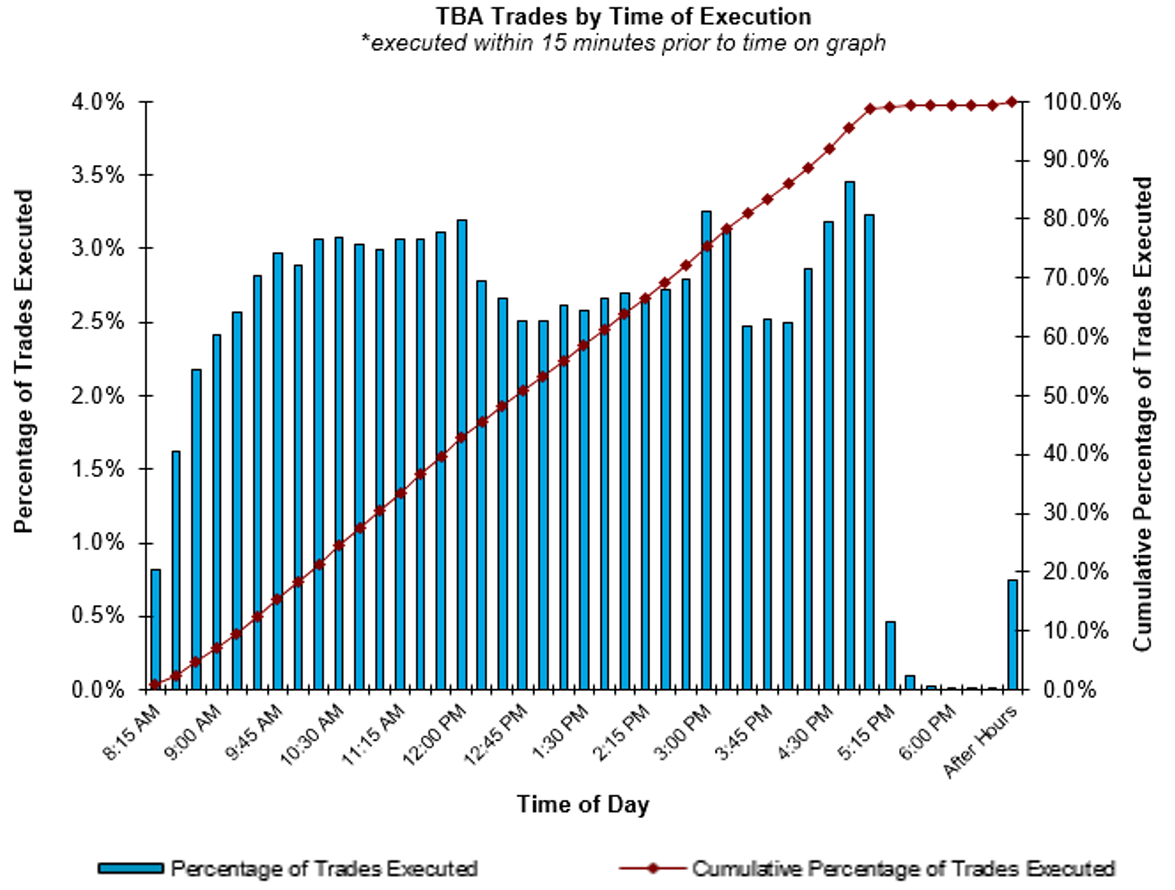
Figure 2: TBA Trades by Time of Execution Source: MIAC Analytics
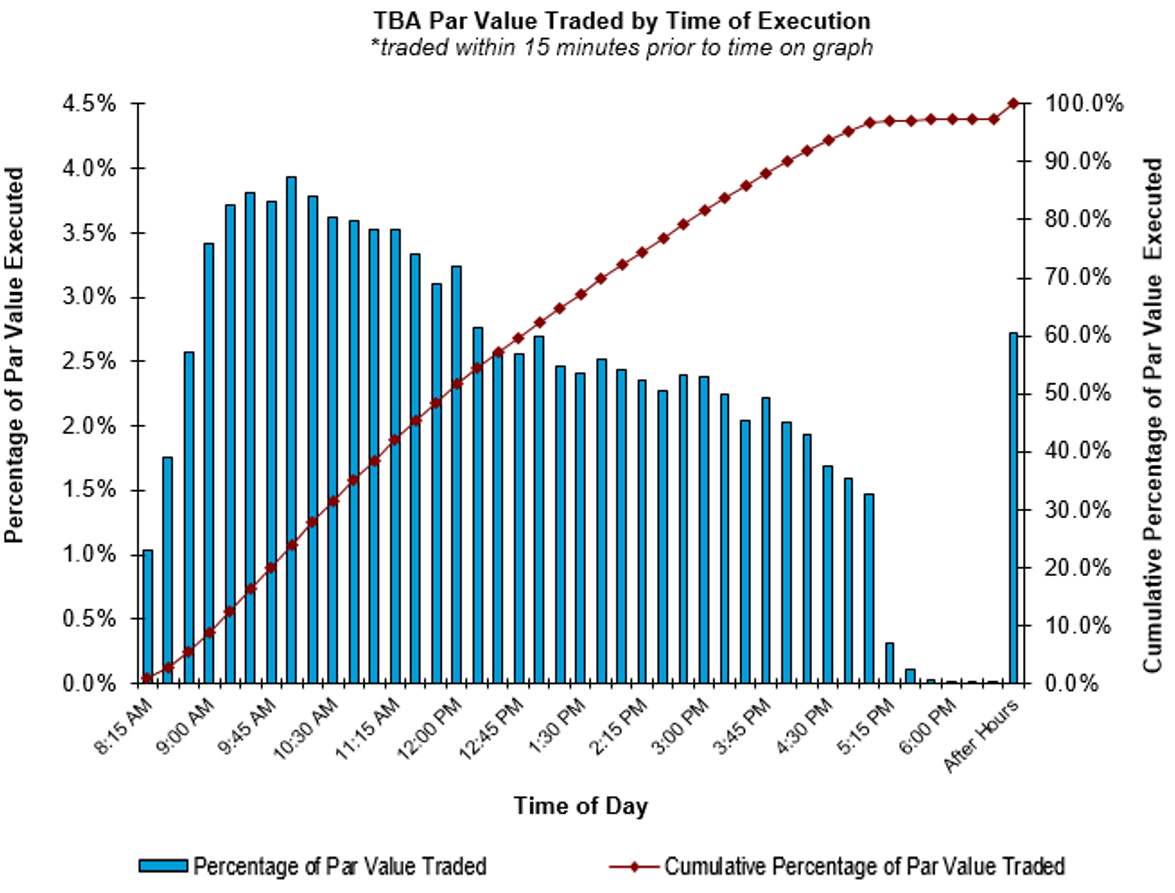
Figure 3: TBA Per Value Traded by Time of Execution Source: MIAC Analytics
Mortgage originator trading activity generally represents approximately 20% of the trading volume in the TBA market. Figure 3 further indicates that mortgage originator secondary hedging employs smaller trade size than the morning market dominated by intra dealer dollar rolls and MBS investor activity.
Lastly, the counterparty risk for TBA market makers requires significant capital to transact with the largest prime broker-dealers. Moreover, the majority of secondary market hedgers are often thinly capitalized, non-banks. To access the TBA markets, they typically transact with regional TBA brokers willing to assume their counterparty risk. Does this materially impact the execution and liquidity for these mortgage banks selling through regional brokers?
If one assumes a typical mortgage banker trades with brokers in the top 10-25 range of active trading firms (Figure 4), we can see that these firms still account for nearly 20% of all trade activity and can infer that execution pricing is reasonably competitive.
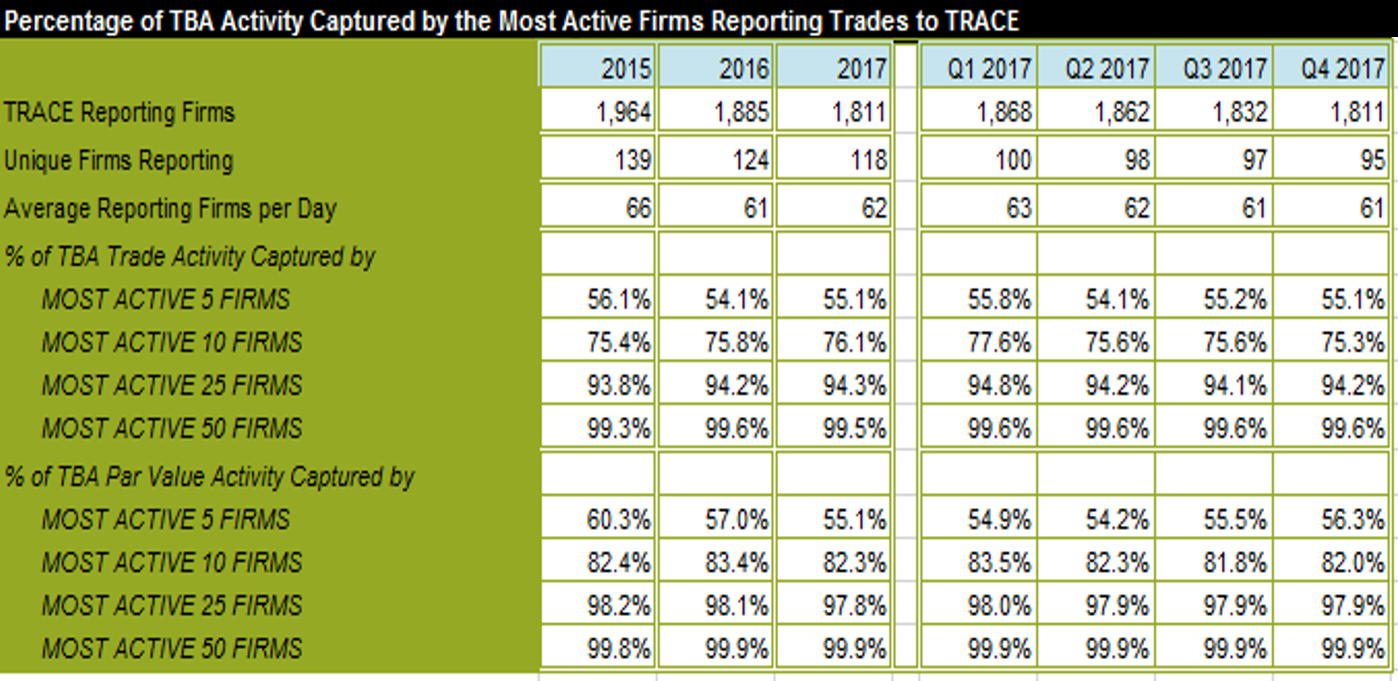
Figure 4: Percentage of TBA Activity Captured by the Most Active Firms Reporting Trades to TRACE Source: MIAC Analytics
MIAC provides mortgage pipeline management and hedge advisory solutions tailored specifically to the goals of your organization. Our team of highly experienced capital markets and risk management professionals uses MIAC MarketShield® technology to provide the precision and transparency necessary to reduce hedging risks and improve our clients’ secondary market execution. Please reach out to your MIAC representative for more information.
Danielle Roper, Senior Vice President, Secondary Solutions Group
‘FINRA 4210: Time to Prepare’