10-Yr Treasury yields ended the week lower at 2.634 as the curve flattened to 16.
Rates finished the week lower as the Treasury market almost seems comfortable trading in the lower-yield range. European economic growth risks wreaked havoc on markets this past week as 2019 gross domestic product forecasts were cut. ISM Non-Manufacturing PMI Index showed the economy is growing at a slower pace after the partial government shutdown. President Trump’s State of the Union address didn’t put anyone’s mind at ease regarding the avoidance of another government shutdown. In the week ahead, there will be a deluge of inflationary and consumption related data releases along with a backlog of data delayed by the government shutdown.

Figure 1: 2/10 Spread Tightened Last Week Source: Bloomberg
EU Economic Outlook
Following Mario Draghi’s comments two weeks ago, it’s no surprise that over Monday night and into Tuesday the EU downgraded its 2019 growth forecasts. The EU forecasts euro-area gross domestic product will grow by 1.3% instead of 1.9% and Italy was cut from 1.2% to 0.2%. Germany appears to be atop of the list of economies to watch as German Industrial Production in December unexpectedly declined -0.4% MoM vs. forecasts of +0.8% and YoY came in at -3.9% vs. -3.4%. US Treasury bonds can be highly influenced by foreign bonds such as the German Bund. On February 14 Germany will release updated economic output estimates. Lower than expected data could cause a sharp drop in the Bund which could extend into US Treasuries.
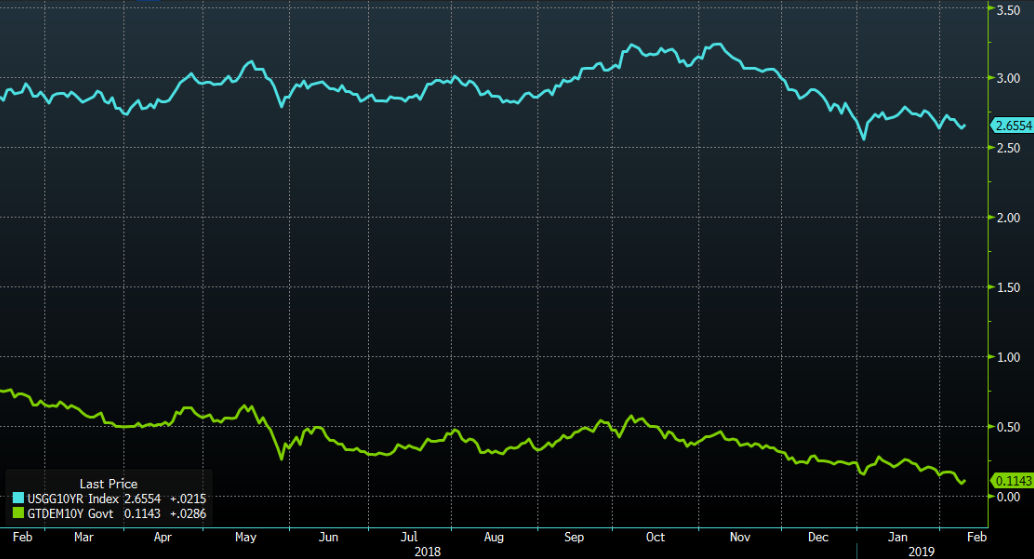
Figure 2: US 10-Yr and German 10-Yr Bund Comparison Source: Bloomberg
ISM Non-Manufacturing Index
The Institute for Supply Management showed the effects of the government shutdown as its nonmanufacturing purchasing managers index (ISM Non-Manufacturing Index) fell to 56.7 in January from 58.0 in December. This was the 108th straight month of expansion as a reading above 50% indicates expansion and below 50% indicates contraction. The Employment Index increased 1.2% in January to 57.8% from the December reading of 56.6%. New orders were down with a reading of 57.7 from 62.7 the previous month but remain very strong. Export orders fell to 50.5 from 59.5. The release stated that “Respondents are concerned about the impacts of the government shutdown but remain mostly optimistic about overall business conditions.”
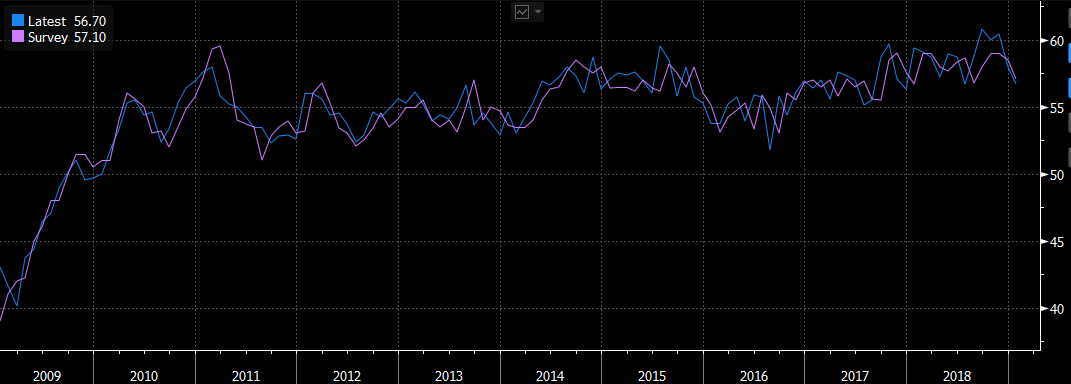
Figure 3: ISM Non-Manufacturing Index Latest Reading Source: Bloomberg
Another Government Shutdown?
Tuesday’s State of the Union address was closely watched as the February 15 wall funding deadline draws near. President Trump steered clear of saying he would declare a state of emergency if a deal wasn’t reached but he did plead his case further. An example of one of the many comments regarding border security, “The lawless state of our southern border is a threat to the safety, security and financial well-being of all Americans”. The fact that President Trump included such comments in the address doesn’t bode well for any potential deal to keep the government fully open beyond that deadline. Depending on how this unfolds, the political uncertainty could cause market volatility this week and the beginning of the next.
TBA Market
10-Yr yields ended the week lower at 2.688 after reaching as low as 2.619 on Thursday. Treasuries rallied after the Fed’s comments on Wednesday but strong job reports on Friday caused a major reversal as 10-Yr yields backed off 15 ticks.
The 2-10 spread at one point had tightened to 14 but ended the week wider at 17. For the past two months, the curve has been primarily trading between 10 bp and bp. On Friday mortgages lagged treasury hedge ratios. 30-Yrs were wider by 3-4 ticks vs. 10-Yr’s led by lower coupons and 15-yr’s were weaker by 1+ tick vs. 5-yr treasuries.
The primary/secondary spread tightened to 86 and G230/FNCL spreads remained close to unchanged. There is additional supply from auctions this coming week, with focus on the 10-Yr auction Wednesday. A poor showing could easily push the curve near or over 20. Stocks ended the week stronger finishing at 25,063.

Figure 4: Market Level at Close of Business Source: Bloomberg
Treasury markets fell over the past week and the curve flattened. 10-Yr yields moved towards their YTD low of 2.54 as the curve slowly tightened ending the week at 16. EU gross domestic product downgrades fueled Treasury market gains as the 10-Yr yield moved in time with the German Bund. Compared to last week coupon spreads between G230 and FN30 are fairly flat in the lower coupons and widened in the higher coupons (5.0%) as MBS struggled to keep pace with U.S. Treasuries. The additional supply from the Treasury auctions didn’t faze bonds. The 10-Yr auction finished with a tail of 0.6 bp, bid-to-cover was 2.35 vs an average of 2.49, and the auction stops at 2.689% vs a 6 auction average of 2.999%. The 30-Yr auction had stronger results with a stop through of 0.2 bp, bid-to-cover was in line with the average 2.27, and the auctioned stopped at 3.022% vs 3.190% (past 6 auction’s average). The primary/secondary spread widened to 94.75 and stocks ended the week slightly higher at 25,106.33.
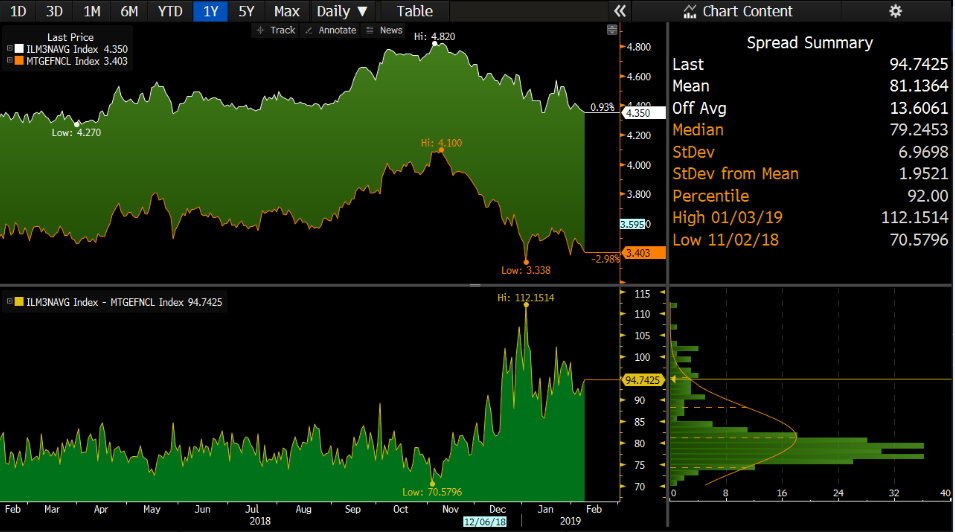
Figure 5: Primary/Secondary Spread Widened Source: Bloomberg
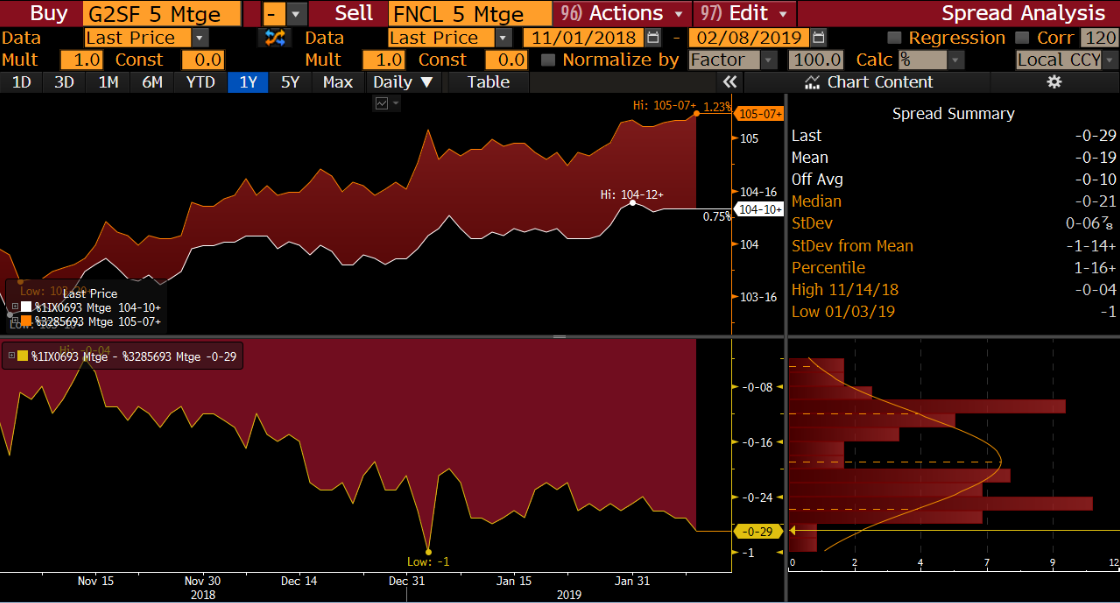
Figure 6: G230/FN30 4 Spread Widens Source: Bloomberg
Weekly Data Releases
In the week to come the Commerce Department will release new and backlogged data due to the government shutdown. A few of the notable backlogged reports include November Business Inventories, December JOLTS & Retail Sales, and the December Budget Statement. New key data releases to watch are Wednesday’s CPI (inflation) and Friday’s Industrial Production.
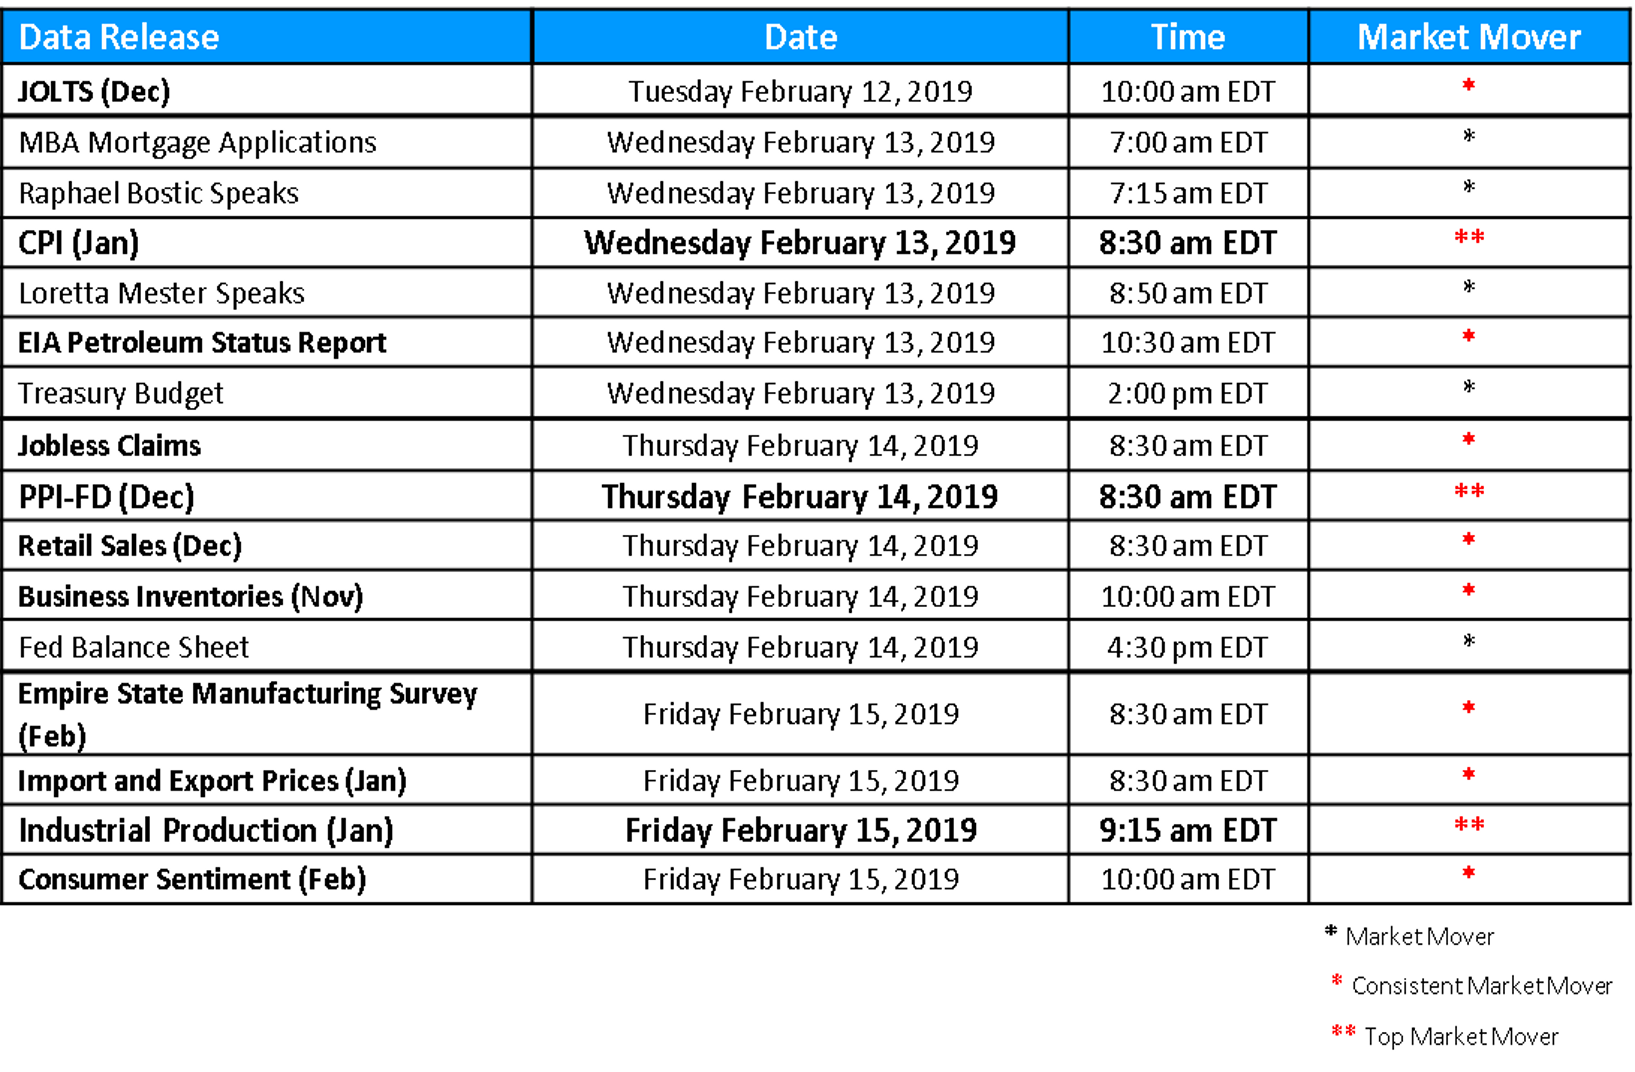
Figure 7: Weekly Data Releases Source: MIAC Analytics™
.
.
.
Secondary Markets Commentary – Week of February 11, 2019
Author
Justin Deaver, Account Manager, Secondary Solutions Group
Justin.Deaver@miacanalytics.com