By Dick Kazarian, Managing Director, Borrower Analytics Group
This Market Overview provides an overview of rates, prepayments, credit, housing markets, policy updates, and other topics of broad interest to mortgage market participants. Subsequent articles provide a deep dive into our CORE™ family of models, the MSR market, and the whole loan market.
In this first article, we review the following topics: Mortgage Rates and Spreads, Prepayment changes from our MIMs Survey, MIMs Contributor Dispersion, and Policy News.
Mortgage Rates and Spreads
Figure 1 displays quarterly snapshots of primary (PMR) and secondary (CCY) 30-year Conventional mortgage rates since the start of the 2021. During 2021, primary rates backed up 55 bps, while secondary rates increased much more: 76 bps. In other words, the primary/secondary spread narrowed by a significant 20 bps.
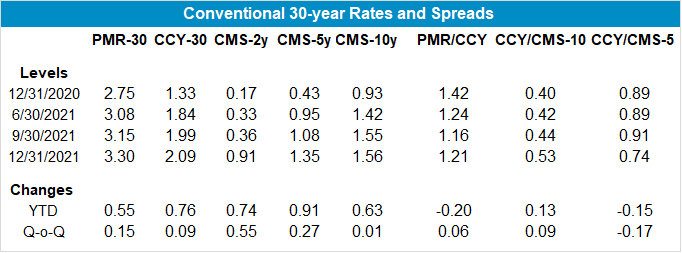
Figure 1: Conventional 30-year Rates and Spreads Source: MIAC Analytics™
This primary/secondary (hereafter, PMR/CCY) spread is driven by numerous factors, including g-fees, servicing and origination costs, and numerous other factors. Aside from the g-fee, this spread can be considered the retail markup over the wholesale cost of mortgages (i.e., the secondary rate). Many of these factors change slowly over time and only impact the long run level of the PMR/CCY spread. For example, technological changes (such as e-closings) and policy shifts (such as appraisal waivers) are expected to gradually lower origination costs over time.
In contrast, the biggest driver of short run dynamics in the PMR/CCY spread is the ability of originators to exercise market power. When rates rally sharply, the demand for refinances increases. Since capacity is fixed in the short run, originators can and do adjust primary rates to ration excess demand. This results in a widening of the PMR/CCY spread, as well an increase in gain on sale margins. Additionally, the larger the newly re-financeable universe, the greater is their pricing power. Over time, as the outstanding mortgage universe gets refinanced and capacity constraints abate, the spread will narrow to an equilibrium level driven primarily by the long-run factors. This is what we have observed since the start of 2021. Should rates rally again from here, retracing the behavior over the past year, the PMR/CCY spread will not widen to its previous highs, since the re-financeable universe is now much smaller.
It is also evident that the secondary/swap (hereafter, CCY/CMS) spread displayed more stability over this time, increasing by 13 bps. In general, the CCY/CMS spread is less volatile than the PMR/CCY spread. Moreover, it is driven by an entirely different set of factors, which explains why the CCY/CMS spread increased while the P/CC spread decreased. These explanatory factors include implied volatility, the slope of the swap curve, generic refinance efficiency, Fed purchases, and CMO activity. During 2021, implied volatility increased and the swap curve flattened. Both of these factors increased the CCY/CMS spread. However, the biggest driver of the widening was Fed activity, specifically Quantitative Tightening (hereafter, QT). QT is likely to be a big story in 2022 and beyond, and as such may contribute to heightened volatility in the CCY/CMS spread.
These same patterns are observed for the 15-year Conventional market, as shown in Figure 2. In fact, the compression of the PMR/CCY spread for the 15-year is even more dramatic (dropping 42 bps vs. 20 bps). This is because the 15-year market is primarily a refinance market, whereas the 30-year market is a blend of purchase and refinance originations. And it’s the sudden excess demand in the refinance market that gives originators their pricing power – purchase activity is simply not that volatile. Note also that the 15-year CCY/CMS widened much less than the 30-year spread, especially if we view the spread relative to a mix of CMS5y and CMS10y.
The complete time series of month-end rates and spreads since the start of the year is displayed in Figures 3 and 4.
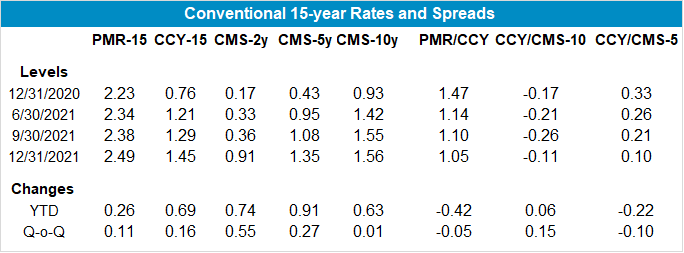
Figure 2: Conventional 15-year Rates and Spreads Source: MIAC Analytics™
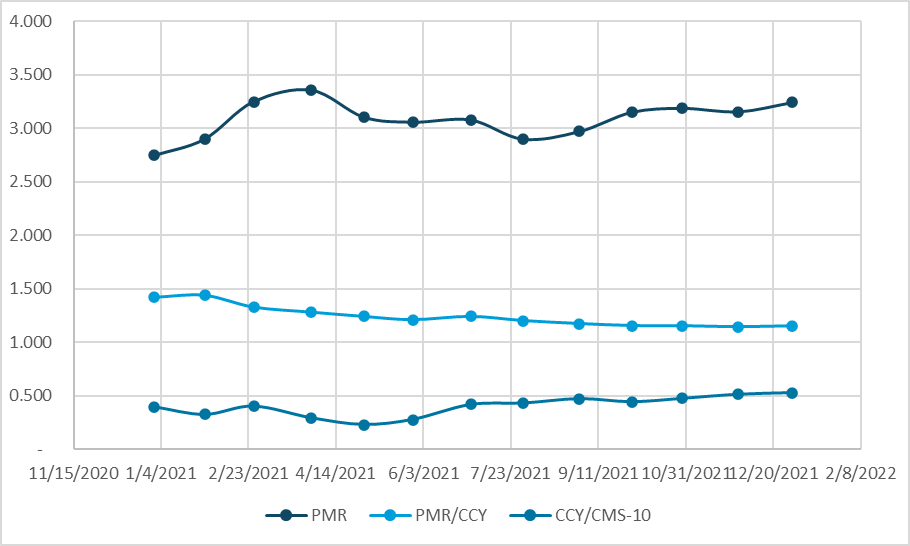
Figure 3: Conventional 30-year Rates and Spreads Source: MIAC Analytics™
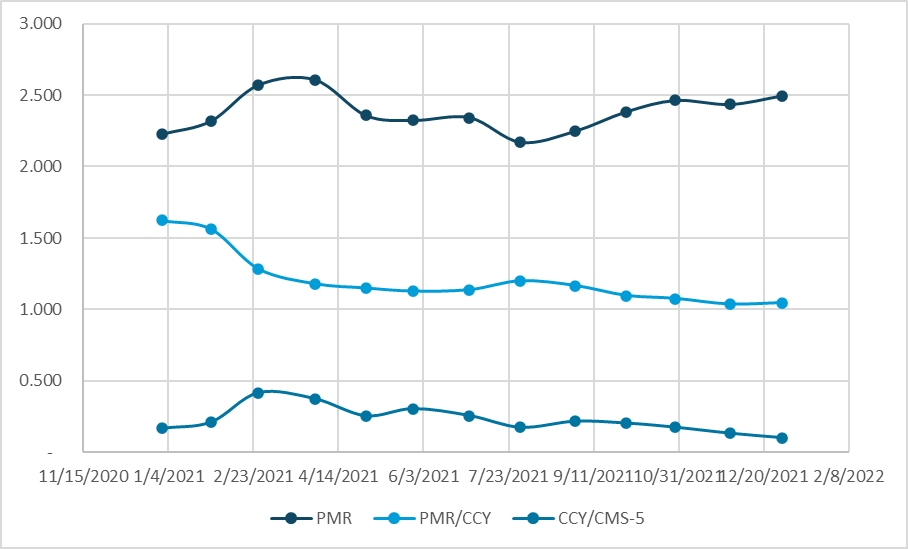
Figure 4: Conventional 15-year Rates and Spreads Source: MIAC Analytics™
Collectively, these dynamics underscore the need for careful independent modeling of the PMR/CCY and the CCY/CMS spreads (i.e., using separate modeling frameworks and input variables). The evolution of both spreads, in either a static or OAS framework, will have a significant impact on valuations, risk sensitivities, and stress valuations. We will save a more detailed discussion of these dynamics for an upcoming issue of MIAC Perspectives.
Improved Market Transparency with MIAC Data Products
In order to track and analyze rates and spreads, it is necessary to have high quality data on all three series. CMS rates have excellent price discovery and are readily available from numerous vendors. For primary mortgage rates, we use the FHLMC survey rate, although we acknowledge that the choice of primary rate series is much discussed among market participants.
This leaves the secondary mortgage rate. Its computation involves two components. The first component is accurate TBA pricing. Although the TBA market is generally quite liquid for coupons close to parity and for the first couple of settlement months, careful processing of the TRACE data can result in improved price discovery relative to other benchmarks. MIAC has developed an IOSCO-compliant TBA Price Fixing Methodology. Our analysis has found that this methodology provides more accurate end-of-day pricing than alternative approaches. The second component of accurate secondary rate computations is the extrapolation methodology. This methodology is particularly relevant when the entire liquid TBA stack is at a premium, which has been the case for much of recent history. For more information regarding MIAC’s TBA Pricing and CCY analytics, please contact your MIAC Sales Representative.
Prepayment Changes from our MIMs Survey
Our MIMs Prepayment Survey for key coupon aggregates over the 2021 calendar year is summarized in Figure 5. In this analysis, the underlying cohort attributes are held constant, and the changes reflect the impact of increases in the primary mortgage alone. These prepayments are median average life equivalent (hereafter, ALE) prepayment speeds inclusive of buyouts. For each coupon aggregate, we calculate the median over all contributors for each cohort and then calculate a UPB-weighted average to aggregate up across vintages to the coupon level.
Several themes are apparent from Figure 5. First, the decline in 15-year Conventional prepayments is much smaller than the decline in 30-year speeds. This is mostly because the increase in the respective primary rate was smaller (25 vs. 55 bps). Second, for 30-years (both Conventional and GNMA), the “cuspier” coupons had the largest prepayment drops. The higher coupons (e.g., 4.0 and 4.5) have already accumulated significant burnout and are therefore much less sensitive to rate changes (i.e., have flatter s-curves). A final observation is that the higher coupon Ginnies generally have higher prepays than their Conventional counterparts. This is mostly due to higher buyouts (mostly within FHA). But this is also the result of slower prepayment burnout accumulation in the Ginnies, as well as very efficient streamlined refinance options.
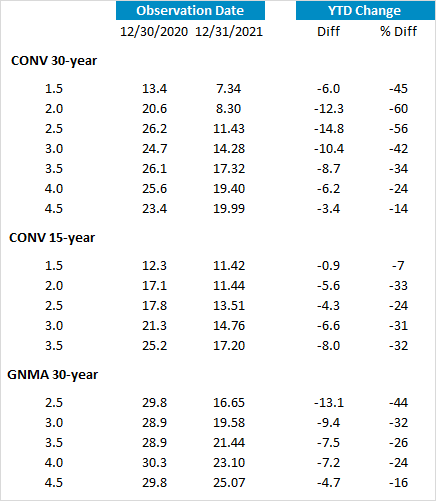
Figure 5: MIMs ™ Prepayment Projections Source: MIAC Analytics™
MIMs Contributor Dispersion
Although not displayed in Figure 5, there is considerable dispersion across survey contributors for numerous major cohorts. That is, the difference across contributors for the same cohort can be substantial, often exceeding 25% of the median value. For cohorts whose WACs are at-the-money (ATM) or below, these differences are partly due to disagreements about how fast pure housing turnover will be in the future (post COVID), as well as how much equity extraction borrowers will engage in. While no researchers expect a return to the significant amount of cash out refinancing that occurred prior to the start of the Great Financial Crisis (hereafter, GFC), there is a no obvious comparable historical period that one can use to benchmark future cash out prepayments. In addition to the expected equity extraction amount, there is also disagreement about the equity extraction mechanism. Should rates rise sufficiently, we expect to see borrowers using second liens (either closed end or HELOC) rather than cash out refinances of their first liens. For example, for 30-year Conventional 1.50 coupons of 2020 and 2021, prepay estimates vary between 7.5 and 12.5 VPR.
GNMA prepay projections merit special consideration for two distinct reasons. First, the accuracy of GNMA prepays depends on how careful analysts are in distinguishing between FHA and VA prepayments. This is particularly important as the cohort seasons and the FHA/VA ratio increases. For more details regarding FHA and VA prepayment and credit behavior, see the Fall 2021 Issue of MIAC Perspectives. Another significant source of cross-contributor variation is GNMA buyouts, especially among the non-bank servicers which have the largest share of GNMA servicing. The uncertainty over Forbearance exits has only exacerbated this buyout uncertainty.
Stay tuned for some upcoming exciting enhancements to our MIMs survey later this year. Also note that new survey contributors are always welcome and receive a free subscription. For more information regarding our MIMs survey, please contact Dick Kazarian.
FHFA Policy News: LLPAs are scheduled to increase – Will FHA MIPs be next?
In early January, the FHFA announced that it will be increasing loan level pricing adjustments (hereafter, LLPAs) for Conventional loans delivered on or after April 1, 2022. Super conforming LLPAs will be increased by 25 to 75 bps, while Second Home LLPAs are scheduled to increase by a much more substantial 1.125 to 3.875 (depending on LTV). These changes are all in the price dimension, the rate impact will be 20-25% of that (assuming a duration of 4-5 years).
Policy Risk is an important component of model risk within residential mortgages
This most recent FHFA announcement is nothing new. Within residential mortgages especially, policy risk is extremely broad and includes topics such as g-fees, adverse market fees, QE/QT, loan limits, FHA fees, new programs, servicer standards, bank capital and liquidity standards, and accounting policies. Complicating matters further, policies are promulgated by different participants (GSEs, Regulators, Legislators, AGs, etc.) and at different jurisdictional levels (including national, state, and municipality).
Policy shifts are challenging. They are common, impossible to accurately predict, often occur during crises or changes in political leadership, and can be very impactful to market prices. Some recent examples include COVID-based foreclosure and eviction moratoria, the adverse refinance fee (enacted and then later rescinded), and the investor cap (imposed and then removed). During and after the GFC, we had HAMP, HARP, and the servicer settlement. Moderately seasoned readers will recall that mortgage “cramdown” legislation was originally included in the 2009 bankruptcy reform bill. That potential game-changer passed the House, but ultimately died in the Senate. And because politicians pay more attention to homeowner/voters than to industry participants in crisis periods, policy risk tends to be detrimental to asset values. Finally, policy shifts tend to cluster in time. In this setting, further changes to both LLPAs and FHA MIPs are likely forthcoming.
LLPAs are established to achieve a desired level of cross-subsidization
It is well-established that the GSEs do not set g-fees and LLPAs to reflect credit losses for each product segment, but rather to achieve a mix of objectives, including cross-subsidization of some borrowers at the expense of others. These latest changes are a case in point. Super-conforming balance loans have lower expected credit losses than conforming balance loans, holding all other attributes fixed. This is primarily because of lower loss severities and somewhat higher prepay speeds. Similarly, holding attributes constant, Second Homes have cumulative loss frequencies that are generally lower than Primary Homes. This is true even though their prepayment rates are lower as well. Second Homes do have marginally higher loss severities, due primarily to lower net proceeds, but are not as high as Investor loans. Our CORE loss severity model handles the impact of Occupancy in both the net proceeds, as well as expense sub-components. In conclusion: the LLPA penalty for Second Homes is motivated much more by desired cross-subsidization (or to reduce the GSE footprint) than by historical performance. In the CORE Insights article, we take a deep dive into the impact of Occupancy on credit losses within CORE.
The budget implications for the GSEs will always be worse than static models suggest
This is really just Econ 101. Increases in fees will always raise less revenue than static models would suggest, because originators will try to find ways to avoid the fees. In this case, market participants are expecting that much of what is now Second Home/Jumbo Conforming will go into PLS or bank portfolios. JP Morgan Research has done some insightful analysis1. Similarly, cuts in fees will always cost more than expected under naïve (or static) models, because demand for that product segment will increase volume. For example, if the FHFA cuts LLPA for low FICO/high LTV borrowers, they will pick up volume from the FHA market (and perhaps beyond).
Prepayment models for existing mortgages must be re-calibrated
By definition, prospective changes will never have any historical data to help with this calibration. The standard way of addressing this change is to introduce an “elbow shift” into the relevant prepayment sub-models. In effect, this just increases the effective opportunity rate by the anticipated rate impact. There is no change to the underlying prepayment model, just a change in the input. We will be implementing this change to our CORE Agency model. But just how big will the elbow shift be? Initially, we’ll follow standard industry convention and assume 25% of the scheduled change in the LLPA grid. But if much of Agency-eligible production goes into PLS or portfolios, this adjustment will have been (in retrospect) too large. As a result, we’ll be monitoring the situation carefully. Finally, we believe that re-financings from Non-Agency investor to Agency investor are minimal, so that no changes to our Non-Agency model are warranted at this time.
The short-run effects will go in exactly the opposite direction of the long-run effects
We expect that new locks and realized prepayments on existing Agency Second Home collateral will increase somewhat between now and the effective date of the changes. However, we checked with our Secondary Solutions (SSG) team, and Second Home locks as a percentage of total locks have been relatively flat as we went to publication.
Conclusion
Overall, 2021 was an active year in terms of rates and spreads, leading to significant changes in realized prepayments, the re-financeable universe, and projected future prepayments. And in early January 2022, the FHFA announced a significant change in LLPAs. Furthermore, based on market movements over the past few weeks, we expect an even more tumultuous and active 2022.
1Source: JP Securitized Products Research, January 5, 2022
MIAC Perspectives: Market Overview
Author
Dick Kazarian, Managing Director, Borrower Analytics Group
Dick.Kazarian@miacanalytics.com