By Mike Carnes, Managing Director – MIAC MSR Valuations Group. GNMA delinquency analysis by Ian Richards, SVP, Borrower Analytics Group.
Key Takeaways
- Lower WAC MSRs continue to command premium pricing due to limited refinance incentive.
- Higher WAC portfolios benefited from slower projected prepayments as rates moved higher.
- Recapture assumptions remain a major driver of pricing dispersion.
- GNMA delinquency trends continue to improve, though severe delinquency concentrations remain elevated.
Fair Market Value Update
After spending much of the past year focused on when and how much the Fed might cut rates, the market has become less certain about the path forward. Inflation remains a concern, economic data has been mixed, and some investors have even begun discussing the possibility that rates could remain higher for longer. As a result, interest rate volatility has remained elevated and expectations for future Fed policy continue to shift.

Source: MIAC Analytics™ – CCY data derived from MIAC’s proprietary TBA Fixings™ and CCY Fixings™ platforms.
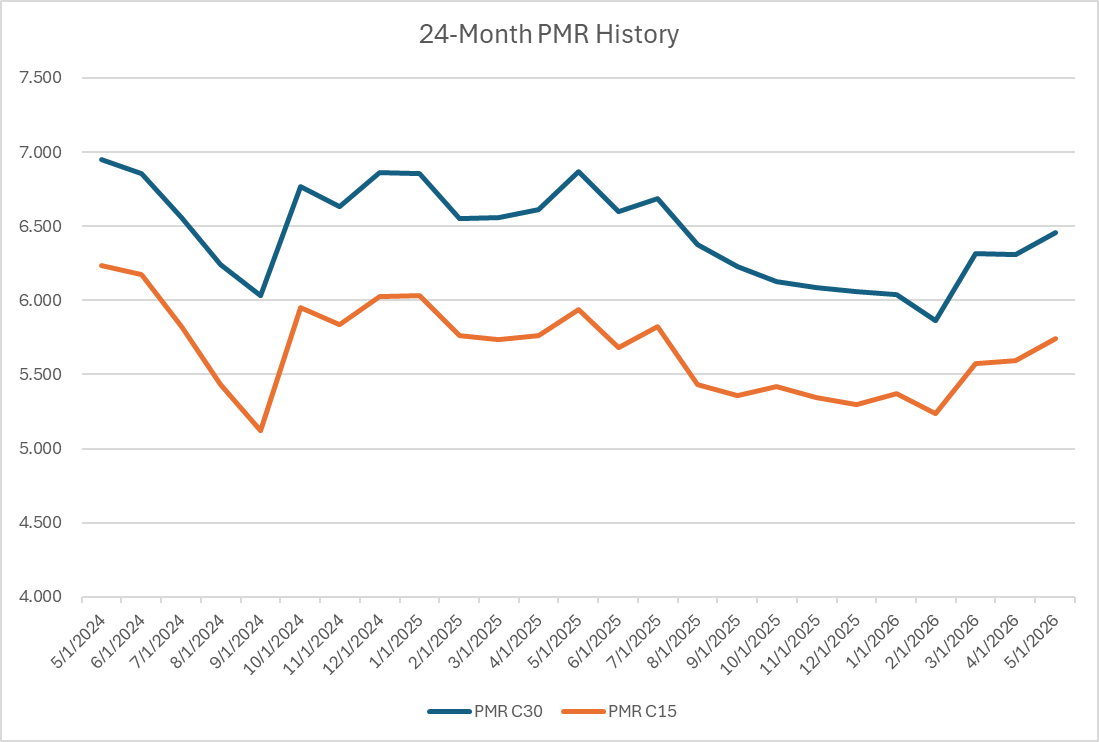
Despite the uncertainty, mortgage rates have generally traded within a relatively narrow range compared to the volatility experienced over the last several years. The most notable exception occurred in March when the start of the Iran conflict pushed rates materially higher and reminded market participants that geopolitical events can still have a significant impact on mortgage pricing. Even after that move, however, the majority of outstanding mortgage borrowers continue to hold rates well below current market levels, limiting broad based refinance incentive across much of the servicing market.
MSR values have generally remained well supported in this environment. Lower WAC portfolios continue to benchmark well against recent transactions and remain in high demand among investors. While pricing can vary considerably based on portfolio characteristics, the market continues to place a premium on stable cash flows and limited refinance exposure.
Higher WAC MSRs remain more sensitive to changes in rate expectations and continue to exhibit greater performance dispersion depending on borrower characteristics, loan age, origination channel, and investor assumptions regarding recapture. While some investors remain cautious toward refinance sensitive collateral, others continue to place meaningful value on recapture opportunities and the ability to retain borrowers through future refinance transactions.
One of the more interesting aspects of today’s market is that a significant percentage of outstanding MSRs were originated during the historically low rate environment of 2020 through 2022. As a result, even a meaningful decline in mortgage rates may not produce the same refinance response observed during prior rate cycles. Of course, the impact will vary considerably based on portfolio composition, but many servicers continue to retain a meaningful amount of lower WAC collateral that remains well out of the money from a refinance perspective.
Source: MIAC Analytics™
Conventional 30-year loans represented in the graph are assumed to be newly originated loans with a 720 FICO, 80% LTV, national average escrow balances, and prepayment behavior based on national averages.
Looking ahead, market participants continue to monitor Federal Reserve policy, inflation trends, labor market conditions, and mortgage rate volatility. While lower rates would likely place additional pressure on certain higher coupon assets, a stable or rising rate environment would generally be supportive of MSR valuations, particularly among lower WAC portfolios with limited refinance incentive.
A continued distinction can be observed between higher and lower WAC MSRs:
- Higher WAC portfolios remain more sensitive to changes in mortgage rate expectations due to their greater refinance propensity. These assets often attract investors with recapture, cross sell, or broader mortgage franchise capabilities that can partially offset runoff risk.
- Lower WAC portfolios continue to appeal to investors seeking stable, longer duration cash flows and limited refinance exposure. These assets generally offer greater cash flow predictability and remain among the most sought after segments of the MSR market.
For institutions without meaningful recapture capabilities, a competitive bid sale process may help identify execution opportunities, particularly for higher WAC or LOCOM accounted portfolios. Conversely, lower WAC MSRs may align more closely with investors focused on duration stability, cash flow predictability, and reduced convexity exposure.
Bulk Pricing Update
The U.S. Treasury 10-year yield moved modestly higher during May, while mortgage rates remained rangebound but generally elevated relative to levels seen earlier in the year. The increase in rates reduced refinance incentive across most coupon cohorts and contributed to improved MSR valuations, particularly among higher-WAC portfolios that are more sensitive to changes in borrower prepayment behavior.
Bulk Agency pricing remained firm during the month, with most performing portfolios continuing to trade in the 5.25x to 5.75x servicing fee multiple range. However, pricing remains highly dependent on collateral characteristics. Well-seasoned, geographically diversified portfolios with attractive average loan balances, favorable note rate dispersion, and strong credit profiles continue to command premium execution. Even smaller portfolios can achieve pricing in the mid-6x range or higher when supported by lower-WAC collateral, attractive loan balances, and clean performance characteristics.
Market demand remains particularly strong for lower-WAC servicing assets where refinance incentive remains limited and projected cash flows are viewed as more durable. While higher-WAC portfolios benefited from slowing prepayment expectations during the month, buyers continue to differentiate sharply based on recapture capabilities, borrower retention strategies, and overall portfolio composition.
In the Government MSR segment, pricing continues to exhibit a wide range of outcomes. While high-quality GNMA portfolios with low delinquency levels and manageable advance exposure continue to attract healthy demand, pricing remains highly dependent on individual portfolio characteristics. Delinquency composition, buyout exposure, geographic concentration, servicing practices, and expected resolution timelines all remain significant drivers of execution. As a result, GNMA valuations can vary substantially from one portfolio to another, often producing a wider range of outcomes than is typically observed in the conventional market.
Recapture assumptions continue to create meaningful pricing dispersion. The difference between a seller valuing a portfolio on a static basis and a buyer incorporating borrower retention strategies can be substantial, particularly for higher-WAC collateral. Depending on portfolio characteristics and buyer capabilities, recapture assumptions can contribute as much as 0.75x to 1.00x of additional servicing multiple value.
For institutions reporting under LOCOM accounting, the modest increase in rates during May provided some support for market valuations. More broadly, buyer liquidity remains healthy and bid depth continues to be robust across both bulk and flow opportunities. Competition remains strongest for clean, performing assets with favorable collateral characteristics, while buyers continue to underwrite credit-sensitive and operationally complex portfolios with greater selectivity. Overall, the market remains constructive for sellers, supported by stable demand, ample liquidity, and improving prepayment dynamics.
MIAC’s Retrospective Analysis: Attribution Framework
MIAC’s Retrospective Analysis provides a detailed evaluation of the performance of MSR and/or hedge positions over a defined period (daily, weekly, or monthly). The framework attributes changes in value to specific market drivers:
-
Parallel Shift (SOFR10Y): Measures the impact of a parallel movement in the long end of the yield curve.
-
Non-Parallel Shift (SOFR Swaps + Treasury Rates, excluding SOFR10Y): Captures the effect of curve steepening or flattening.
-
Primary-Secondary Spread (PS Spread): Reflects changes in mortgage rates and borrower prepayment incentives.
-
Secondary-Secondary Spread (SS Spread): Measures changes in secondary market pricing and servicing asset valuations.
-
Volatility: Evaluates the impact of changes in implied market volatility.
- OAS Basis: Captures changes in option-adjusted spreads and mortgage market risk premiums not otherwise reflected in rate or spread movements.
-
Time (Aging): Reflects the effect of the passage of time and the natural runoff of expected cash flows.
- Assumption Changes: Captures the impact of any changes to valuation assumptions, including prepayment, default, severity, recapture, or cost-to-service estimates.
Source: MIAC Analytics™
MIAC GSA Retrospective Analysis – Month-End Update
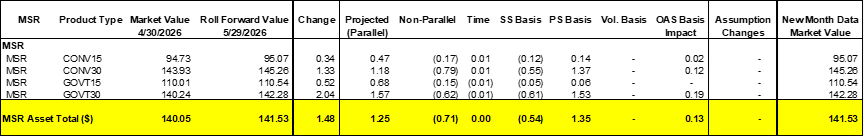
MIAC’s GSA Retrospective Analysis for the period ended May 29, 2026 reflected a gain of 1.48 basis points in overall MSR values compared with April 30, 2026. Performance was positive across all major product types, with longer-duration assets and higher-coupon cohorts leading the market higher.
The primary driver of performance was tightening prepayment-spread (PS) basis, which contributed +1.35 basis points to aggregate valuations. Parallel rate movements also provided meaningful support, adding +1.25 basis points as modestly higher mortgage rates reduced refinance incentives. These favorable factors were partially offset by non-parallel curve movements (-0.71 bps) and servicing-spread (SS) basis widening (-0.54 bps). OAS tightening contributed a modest +0.13 basis points, while volatility, time decay, and assumption changes had little impact on overall results.
By product type:
- Conventional 15-year MSRs increased +0.34 bps, supported by favorable rate movements and improved prepayment expectations.
- Conventional 30-year MSRs rose +1.33 bps as higher rates and PS basis tightening more than offset modest spread widening.
- Government 15-year MSRs increased +0.52 bps, reflecting stable market conditions and modest curve-related gains.
- Government 30-year MSRs posted the strongest performance, gaining +2.04 bps, driven by favorable rate movements, improved prepayment expectations, and modest OAS tightening.
The month’s performance was driven almost entirely by market-related factors rather than changes to valuation assumptions. Modestly higher mortgage rates reduced refinance incentives across most cohorts, supporting slower projected prepayment speeds and improving the expected duration of future servicing cash flows.
Overall, May represented a constructive month for MSR investors. The combination of higher rates, slower projected prepayments, and continued buyer demand helped push valuations higher across most product types, with the strongest gains occurring in sectors most sensitive to changes in refinance activity.
Coupon and Product Performance Analysis
Source: MIAC Analytics™
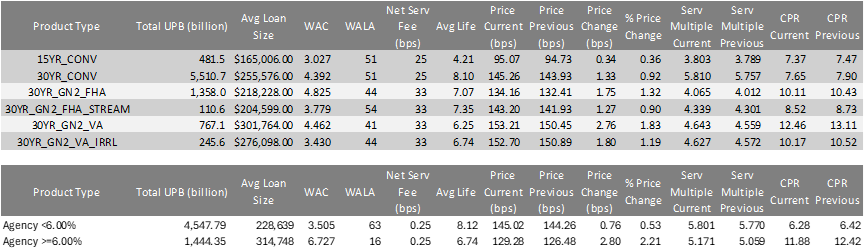
As illustrated, higher-WAC Agency MSRs (≥6.00%) were the strongest-performing segment during the month. Prices increased 2.80 basis points, while servicing multiples expanded from 5.06x to 5.17x. Unlike recent periods where higher-coupon assets faced pressure from elevated refinance risk, rising mortgage rates reduced refinance incentives and drove CPR expectations lower, declining from 12.42% to 11.88%. This cohort benefited disproportionately from the market move given its greater sensitivity to changes in borrower refinancing behavior.
Higher-WAC portfolios also remain the segment where effective recapture strategies can have the greatest impact on valuation. While recapture benefits vary considerably by servicer and borrower profile, portfolios with strong refinance and retention capabilities are generally better positioned to preserve servicing cash flows during future rate rallies. As a result, market participants continue to place meaningful value on demonstrated recapture performance when evaluating higher-coupon servicing assets.
Lower-WAC Agency MSRs (<6.00%) also posted gains, though to a lesser degree. Prices increased 0.76 basis points, while servicing multiples improved from 5.77x to 5.80x. CPR expectations declined modestly from 6.42% to 6.28%, reflecting the fact that refinance incentive remains limited for much of this population regardless of moderate rate fluctuations. As a result, lower-WAC portfolios continued to demonstrate the duration stability that has characterized this segment throughout much of the current rate cycle.
At the product level, the strongest performer was 30-year GNMA VA MSRs, which increased 2.76 basis points as CPR expectations declined from 13.11% to 12.46%. Other notable gainers included 30-year GNMA VA IRRRL (+1.80 bps), 30-year GNMA FHA (+1.75 bps), and 30-year Conventional (+1.33 bps) MSRs. Conventional 15-year and Government 15-year MSRs posted more modest gains of 0.34 and 0.52 basis points, respectively, reflecting their lower duration and reduced sensitivity to changes in refinance incentives.
The month represented a reversal from several prior periods in which higher-coupon MSRs experienced greater valuation pressure. As mortgage rates moved higher, refinance expectations moderated across the market, providing the greatest benefit to those cohorts with the highest propensity to refinance. While lower-WAC portfolios continue to offer superior duration stability, May demonstrated that higher-coupon assets can experience significant value appreciation when market conditions shift in favor of slower prepayments.
Overall, the data suggest that the recent rise in mortgage rates has improved the outlook for MSR investors by extending expected cash flows and reducing prepayment risk. Although market volatility and spread movements remain important considerations, the dominant theme during the month was the favorable impact of slower projected prepayments, particularly among higher-coupon servicing portfolios.
NonQM MSR Update
Liquidity in the NonQM MSR market remained solid during the month, with investors continuing to focus on stable collateral, slower runoff, and portfolios with meaningful prepayment protection. Bid activity across performing NonQM product remains healthy, particularly for recent production and portfolios with consistent payment performance. Similar to the broader MSR market, execution continues to vary significantly based on collateral mix, refinance exposure, and overall portfolio composition.
Execution levels for NonQM servicing assets remain well supported, particularly for portfolios with stronger duration characteristics and lower expected runoff. Investor demand continues to be strongest for DSCR collateral and portfolios containing larger concentrations of prepayment-protected loans. Buyers also continue to focus heavily on cash flow stability, borrower equity, and refinance sensitivity when evaluating portfolios.
DSCR MSRs continue to trade better than Bank Statement collateral in most observed executions. Investors generally continue to view DSCR collateral as more stable relative to self-employed borrower profiles commonly associated with Bank Statement production. Bank Statement MSRs continue to maintain healthy liquidity, although pricing remains somewhat more sensitive to broader economic conditions and borrower income volatility.
Prepayment penalties also continue to be one of the larger drivers of value within the NonQM servicing market. Portfolios with meaningful concentrations of 3-year and 5-year prepayment protection continue to attract strong investor demand due to slower expected runoff and improved cash flow stability. Given the current rate environment and uncertainty around future refinance activity, investors continue to place significant value on the extension protection provided by prepayment penalties.
GNMA Delinquency Update
Recent GNMA delinquency trends have continued to improve modestly, although the improvement remains concentrated more in overall delinquency balances than in the heavier delinquency buckets. According to the most recent available data, total D60+ delinquent UPB declined to approximately $144.3 billion, while total loss mitigation removals increased materially to roughly $4.02 billion. Modification activity also continued to accelerate, reaching approximately $2.69 billion during the reporting period.
At the same time, the data continues to suggest that many servicers dealing with delinquency issues are facing severe delinquency problems rather than broad-based new credit deterioration. Overall delinquency balances have improved modestly, but a large portion of the remaining delinquent population continues to migrate into heavier delinquency buckets as foreclosure timelines remain extended and borrowers continue moving through the Ginnie Mae loss mitigation process.
EBO activity increased modestly during the most recent reporting period, rising to approximately $1.33 billion. While buyout activity remains meaningful, it continues to be concentrated in higher coupon collateral, highlighting the ongoing exposure tied to heavily delinquent high-coupon GNMA loans.
Performance dispersion across servicers also remains significant. Approximately 100 servicers, including 40 platforms with more than $1 billion in GNMA MSRs, currently report DQ3% rates greater than or equal to 4.5%. In addition, 94 servicers, including 31 billion-dollar platforms, continue to report total delinquency rates at or above 10%.
Perhaps the most notable trend continues to be the divergence between overall delinquency improvement and the migration of remaining delinquent borrowers into more severe delinquency buckets. Despite more than $4 billion of loss mitigation removals during the most recent reporting period and continued declines in aggregate delinquency balances, many borrowers continue to progress through the delinquency cycle before ultimately receiving a modification or other workout solution. As a result, the concentration of severe delinquencies remains elevated even as overall delinquency balances gradually improve.
The recent increase in foreclosure headlines also continues to require context. Much of the current activity appears tied less to broad-based deterioration in consumer credit and more to the ongoing evolution of loss mitigation programs and resolution timelines within the GNMA market. Borrowers are generally spending longer periods in delinquency before resolution, contributing to elevated severe delinquency statistics even as many ultimately receive loss mitigation assistance. This dynamic has contributed to a continuing cycle in which delinquent loans are modified, re-delivered, and in some cases subsequently re-default, prolonging the overall resolution process.
The current environment continues to highlight the importance of detailed loan-level performance analytics and behavioral modeling when evaluating GNMA servicing portfolios. MIAC’s CORE™ behavioral modeling platform and Servicer Performance Analysis (SPA) tools provide valuable insight into runoff behavior, delinquency migration, modification performance, and comparative servicer analytics. Clients interested in additional performance benchmarking or comparative servicing analytics are encouraged to contact their MIAC representative for additional information.
Why MIAC?
For more than three decades, MIAC has been a trusted provider of MSR valuation, analytics, and brokerage services to banks, independent mortgage companies, credit unions, REITs, hedge funds, and institutional investors. Our valuation platform supports the analysis of more than $50 trillion of residential and commercial MSRs annually, providing clients with independent fair value opinions, portfolio analytics, and market intelligence across virtually every segment of the servicing market.
What differentiates MIAC is the combination of industry-leading analytics and active market participation. In addition to valuing MSRs, MIAC is one of the industry’s most active brokerage firms, providing clients with real-time insight into buyer demand, pricing trends, transaction structures, and market execution. This unique perspective allows us to bridge the gap between theoretical value and actual market pricing.
Whether evaluating a portfolio for financial reporting, strategic planning, or sale, MIAC helps clients understand not only what their assets are worth, but also how those assets are likely to be viewed by the marketplace. From traditional agency MSRs to GNMA, non-agency, commercial servicing, excess servicing, and other specialized servicing assets, MIAC provides the analytics, market intelligence, and transaction expertise necessary to support informed decision-making.
At its core, MSR valuation and brokerage require credibility, market insight, and execution. MIAC brings all three together.