
By Mike Carnes, Managing Director, MSR Valuations Group
Interest Rates and MSR Performance
For much of the past year, the rate conversation centered around when the Fed would cut and how quickly rates might come down. That conversation has changed quite a bit. At its July meeting, the Fed left the federal funds rate unchanged at 3.50% to 3.75%, but three members voted in favor of a 25-basis-point increase. Inflation has come down from its peak but remains above the Fed’s target, leaving the path forward much less certain than it appeared earlier in the year.
July CPI increased 3.4% from a year ago, down slightly from 3.5% in June. Mortgage rates, meanwhile, continue to be fairly stubborn. Freddie Mac’s 30-year mortgage rate averaged 6.67% as of August 13 and has remained in a relatively narrow range over the past several weeks.

From an MSR perspective, this continues to be a fairly supportive environment. Despite all the discussion around future Fed policy, mortgage rates haven’t moved enough to materially change the refinance picture for a large portion of the existing mortgage universe.
That’s particularly true for loans originated during the historically low-rate environment of 2020 through 2022. A significant percentage of those borrowers remain well out of the money from a refinance perspective. Even a meaningful decline in mortgage rates wouldn’t necessarily bring all of that population back into the refinance window.
Higher-WAC MSRs remain considerably more sensitive to changes in mortgage rates. A relatively small move in rates can create meaningful refinance incentive for these borrowers, with actual prepayment behavior also influenced by borrower credit, loan age, origination channel and recapture capabilities.
Lower-WAC MSRs are a different story. With many borrowers still holding mortgage rates well below today’s market, these assets continue to offer relatively stable and longer-duration cash flows. That stability is one of the primary reasons lower-WAC servicing continues to attract some of the strongest demand in the market.
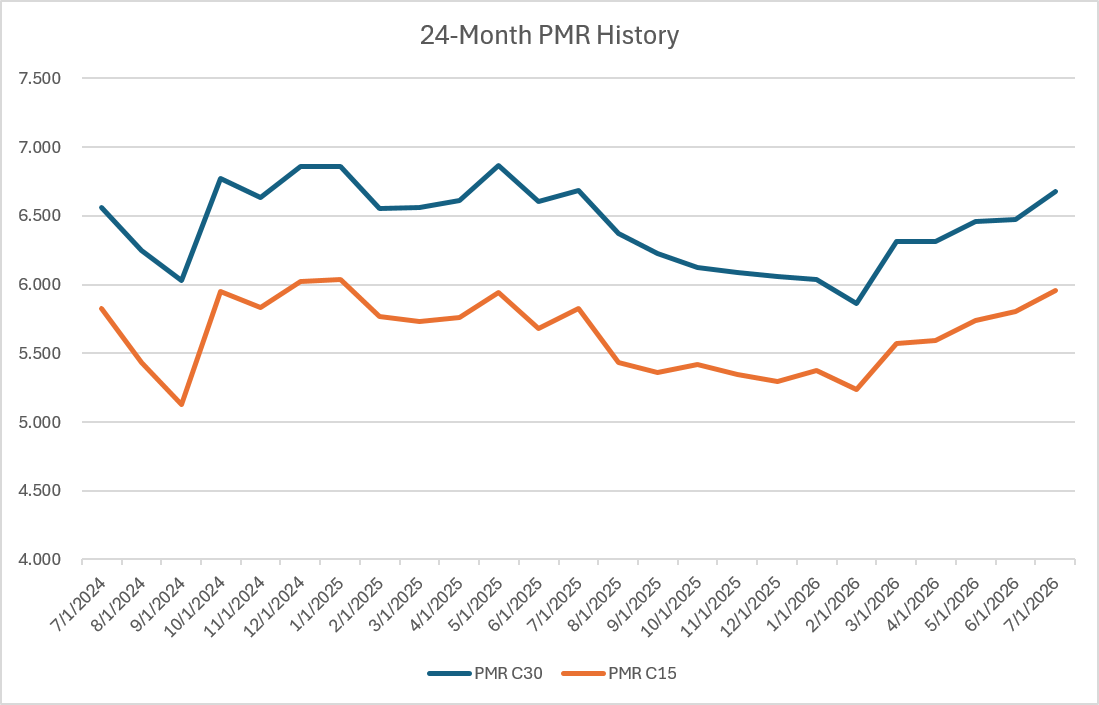
One thing MIAC continues to watch closely is how much rates actually need to decline before we see a meaningful change in borrower behavior. The answer isn’t the same for every portfolio. For a borrower with a 3% or 4% mortgage, even a fairly significant rally may do very little. For a borrower in the 6% to 7% range, a much smaller move can change the economics considerably.
|
3% to 4%
Even a fairly significant rally may do very little.
|
6% to 7%
A much smaller move can change the economics considerably.
|
That doesn’t mean lower-WAC MSRs are insulated from changes in rates. While their prepayments may be less sensitive to a rally, their values can still be affected by changes in earnings rates on escrow and other float balances, as well as discount rates and other market assumptions. The risk is simply different than it is for a higher-WAC portfolio.
That’s why looking only at the direction of rates can sometimes be misleading when thinking about MSR performance. What matters just as much is where the borrowers in a particular portfolio sit relative to the prevailing mortgage rate and how likely they are to respond when that spread begins to narrow.
Looking ahead, inflation, labor market conditions, geopolitical developments and Fed policy will all continue to influence mortgage rates. For MSR holders, however, the bigger question remains the same: how much of the portfolio actually becomes refinanceable at the next move lower in rates? For many lower-WAC portfolios, that answer may still be relatively little.
MIAC Retrospective Analysis
MIAC’s Retrospective Analysis is designed to explain not only how much an MSR portfolio changed in value, but why it changed. The analysis can be performed daily, weekly or monthly and breaks the change in value into the following components:

GSA Retrospective Analysis – Month-End Update
MIAC’s latest GSA Retrospective Analysis reflected a 4.05-basis-point increase in overall MSR values, with the aggregate value increasing from 141.28 bps to 145.33 bps.
| Parallel movement in rates | +3.89 bps |
| Non-parallel curve movements | +1.10 bps |
| PS spread movements | +0.11 bps |
| SS spread movements | +0.22 bps |
| Volatility | -1.33 bps |
| Time | +0.06 bps |
The biggest driver was the parallel movement in rates, which contributed 3.89 bps to the overall change. Non-parallel curve movements added another 1.10 bps, while PS and SS spread movements contributed 0.11 bps and 0.22 bps, respectively. These gains were partially offset by volatility, which reduced values by 1.33 bps. Time contributed a modest 0.06 bps, while OAS and assumption changes had essentially no impact.
What stands out in the analysis is that the increase was almost entirely market driven rather than the result of changes to MIAC’s modeling assumptions. CPR also declined across every product in the analysis, with some of the larger moves occurring in the Government sector.
Product Performance Analysis
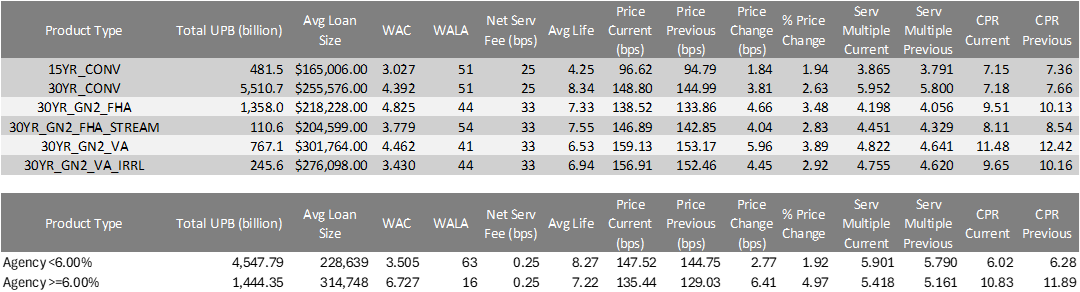
The strongest performer during the month was 30-year GNMA VA servicing, which increased 5.96 basis points, or 3.89%, while its servicing multiple increased from 4.641x to 4.822x. Projected CPR declined from 12.42% to 11.48%.
GNMA FHA also performed well, increasing 4.66 bps, or 3.48%, as CPR declined from 10.13% to 9.51%. FHA Streamline increased 4.04 bps, while VA IRRRL increased 4.45 bps.
Conventional 30-year MSRs increased 3.81 bps, or 2.63%, with the servicing multiple moving from 5.800x to 5.952x. CPR declined from 7.66% to 7.18%. Conventional 15-year MSRs increased a more modest 1.84 bps, while CPR declined from 7.36% to 7.15%.
The takeaway this month is fairly simple. When expected prepayments slow, MSRs that are more sensitive to borrower refinance behavior can benefit more from that change. That’s what we saw this month, with the Government 30-year products experiencing some of the largest increases in value.
There is an important distinction with the Government results. MIAC’s GSA cohorts remain static for a one-year period, so the monthly results measure changes in rates, prepayments and other market factors on the same underlying population of loans. They don’t reflect changes in the credit composition of the broader GNMA population during that period. As a result, the strong performance of the Government GSA cohorts shouldn’t necessarily be viewed as inconsistent with the credit trends discussed later in this Update.
Historically, higher delinquencies have generally been associated with slower voluntary prepayments. From an MSR standpoint, that created two competing effects. Slower voluntary prepayments could extend the servicing cash flows, while higher delinquencies increased servicing, advancing and resolution costs. Depending on the portfolio, the net impact could go either way.
That relationship has become more complicated. MIAC’s most recent FHA and VA prepayment modeling recognizes that some delinquent borrowers may sell their homes, resulting in a due-on-sale payoff. While that creates faster runoff and reduces the remaining servicing cash flow, it can also avoid some of the costs associated with a borrower progressing further through delinquency. The net impact will ultimately depend on the path the borrower takes.
The retrospective analysis also helps show why looking only at the beginning and ending MSR value doesn’t always tell the full story. A 4.05-basis-point increase tells us what happened. Breaking that change into rates, curve movements, spreads, volatility, time and assumptions helps explain why it happened.
For institutions actively managing or hedging MSR exposure, that distinction can be important. MIAC’s Retrospective Analysis separates market-driven performance from assumption changes and provides a clearer picture of the factors contributing to the change in value.
Bulk MSR Market Update
Over the past month, we’ve had a number of conversations with both buyers and sellers, and one question continues to come up: where is the MSR market today?
The answer has become a little more nuanced than simply quoting a market multiple.
Overall, we would characterize the market as healthy. Buyer demand remains strong, financing continues to be available, and there continues to be plenty of interest in quality Agency servicing. Bulk Agency pricing is generally in the 5.50x to 6.25x range, but that range doesn’t tell the whole story. We’ve now seen a number of lower-WAC Agency portfolios trade in the very high 6x range. Based on the transactions we’ve observed, however, the market has yet to break through the psychological 7x barrier.
Buyers have always looked at note rate, loan balance, geography, credit, delinquency, float, recapture and servicing costs. What seems different today is how much those individual characteristics are driving the final price. Two portfolios that look fairly similar at a high level can produce very different results once buyers get into the loan-level details.
We’re also seeing some fairly wide bid ranges on the same portfolio. We don’t necessarily view that as buyers disagreeing about what the MSRs are worth. More often, it reflects differences in their business models. A buyer with a strong origination platform may place considerably more value on recapture. Another may be more focused on float income or servicing efficiencies. Geography, existing concentrations and cost to service can also cause buyers to look at the same portfolio differently.
Recapture continues to be one of the bigger sources of pricing differences, particularly on higher-WAC portfolios. Depending on the collateral and the buyer, we’ve seen recapture add as much as 0.75x to 1.00x to the servicing multiple. Lower-WAC servicing, meanwhile, continues to command some of the strongest pricing because borrowers have less refinance incentive and the expected cash flows are generally more durable.
The same loan-level analysis becomes even more important with GNMA servicing. Clean, performing GNMA portfolios can trade in the high 4x to low 5x range, but credit and delinquency matter considerably. We think some caution is warranted when risk is evaluated too heavily using portfolio averages or broad credit groupings.
|
750 FICO
Performing borrower
|
550 FICO
Delinquent borrower
|
As an example, grouping a performing 750 FICO borrower with a delinquent 550 FICO borrower may produce a reasonable average for the overall population, but those are two very different MSRs from a risk and cost standpoint. The lower-credit delinquent borrower can have a materially different probability of default and expected servicing and resolution costs. Those differences can be less visible when loans are evaluated using broad portfolio groupings.
That’s why we continue to caution clients against becoming too focused on the market multiple. Multiples are still a useful benchmark and an easy way to talk about the market, but they’re really just a starting point. Understanding the collateral and knowing which buyers are likely to place the most value on it can provide a better indication of where a portfolio may ultimately trade.
It’s also one of the reasons MIAC has always believed strongly in loan-level MSR modeling. Through CORE™, we’re able to evaluate the individual characteristics and expected behavior of each loan rather than relying solely on broad portfolio averages or cohort-level assumptions. As the market places more emphasis on credit, delinquency, recapture and other loan-level characteristics, we believe that level of detail becomes increasingly important when determining fair market value.
GNMA Delinquency Update
|
$148.9B
D60+ delinquent UPB
|
$4.16B
Removed through loss mitigation
|
$2.88B
Modification activity
|
GNMA delinquency trends showed some modest improvement in July. After increasing for several months following the tax refund season, D60+ delinquent UPB declined to approximately $148.9 billion from $149.7 billion in June. While the improvement was relatively small, it marked the first decline in D60+ balances since the seasonal improvement earlier in the year.
Loss mitigation activity remains very active. Approximately $4.16 billion was removed from GNMA pools through loss mitigation during July, up slightly from $4.11 billion in June. Modification activity also increased, rising from approximately $2.76 billion to $2.88 billion. Despite the recent changes to FHA loss mitigation, more than $4 billion of collateral continues to be removed from GNMA pools each month through loss mitigation.
EBO activity was relatively unchanged. Approximately $1.29 billion was bought out of GNMA pools during July, compared with $1.34 billion in June.
The July numbers are encouraging in that severe delinquency declined rather than continuing to build. At the same time, we think it’s too early to view one month as a change in the broader trend. The amount of collateral moving through loss mitigation remains significant, and the modest reduction in D60+ balances occurred alongside another month of more than $4 billion in loss-mitigation removals.
Historically, one potential offset to higher delinquency has been slower voluntary prepayments. That relationship isn’t necessarily as straightforward today. MIAC’s recent FHA and VA prepayment modeling recognizes that some delinquent borrowers may sell their homes, resulting in a due-on-sale payoff. While that means faster runoff of the MSR, it can also avoid some of the servicing, advancing and resolution costs associated with a borrower progressing further through delinquency.
|
95
Servicers with DQ3% rates of 4.5% or greater
|
94
Servicers with total delinquency rates of 10% or greater
|
The dispersion among servicers also remains significant. There are currently 95 servicers with DQ3% rates of 4.5% or greater, including 40 platforms with more than $1 billion in GNMA MSRs. In addition, 94 servicers report total delinquency rates of 10% or greater, including 31 platforms with more than $1 billion in GNMA servicing.
From an MSR perspective, this matters because not all delinquency carries the same economic risk. As loans move into the more severe delinquency buckets, expected default, servicing and resolution costs can change considerably. Portfolio-level averages can therefore hide meaningful differences in the expected economics of individual MSRs.
There is also an interesting timing question for GNMA MSR holders. Values are getting support from the current rate and prepayment environment while credit and loss-mitigation activity remain elevated in portions of the GNMA market. For holders with more exposure to higher-risk servicing, this may be a good time to evaluate that exposure and consider how current market values compare with the longer-term risk of continuing to hold it. The answer is going to depend heavily on the actual loans behind the portfolio.
This continues to reinforce the importance of loan-level performance analytics when evaluating GNMA servicing. MIAC’s CORE™ behavioral modeling platform evaluates expected borrower behavior and delinquency risk at the loan level, while Servicer Performance Analysis, or SPA, provides additional insight into delinquency migration, modification performance and comparative servicer trends. Together, they provide additional detail that may not be visible in portfolio-level delinquency statistics alone.
Float Continues to Matter
While longer-term rates receive most of the attention when discussing MSR values, short-term rates continue to provide meaningful support through float income.
Today’s float earnings remain meaningful, even though most market participants expect short-term rates to gradually normalize over the longer term. We don’t see many buyers capitalizing today’s float income indefinitely. Most continue to underwrite earnings using longer-term rate expectations rather than assuming today’s environment will continue.
As always, the impact varies considerably from one portfolio to another. Escrow balances, remittance characteristics, servicing mix and operating costs all influence how much value buyers ultimately assign to float income.
This is another area where a headline servicing multiple doesn’t always tell the full story. Two portfolios with similar servicing fees and prepayment characteristics can still have different economics based on how much float they generate and how efficiently that float can be monetized.
Static Valuation versus OAS
We’ve also received a noticeable increase in questions regarding static valuations versus option-adjusted spread, or OAS, methodologies. Some of that seems to be coming from institutions evaluating fair value accounting and, in other cases, considering whether active hedging strategies make sense for their servicing portfolios.
Our view is that this isn’t really a question of which methodology is better. They’re designed to answer different questions.
|
Static Valuation
Estimates fair value based on today’s market environment using assumptions consistent with current market conditions.
Financial reporting and transaction pricing
|
OAS
Evaluates the servicing asset across multiple potential interest rate paths rather than estimating value under one rate environment.
Hedging and interest rate sensitivity
|
A traditional static valuation estimates fair value based on today’s market environment using assumptions consistent with current market conditions. For financial reporting and transaction pricing, a properly constructed static valuation can provide a market-based estimate using assumptions consistent with the current environment.
An OAS framework adds another dimension by evaluating the servicing asset across multiple potential interest rate paths. Rather than estimating value under one rate environment, it estimates value across many possible future environments. That can provide useful information for institutions that actively hedge servicing assets or want to better understand interest rate sensitivity.
One misconception we occasionally hear is that OAS must be better simply because it’s more sophisticated. We don’t necessarily agree. If the objective is to estimate today’s fair market value, more complexity doesn’t automatically produce a better answer. Depending on the purpose of the analysis, a well-calibrated static valuation may be appropriate because it is directly aligned with current market participant assumptions.
On the other hand, if the objective is to understand how an MSR portfolio may behave as rates change, evaluate hedge effectiveness or measure interest rate exposure, an OAS framework can provide information that a static valuation wasn’t designed to provide.
We expect more institutions will use both. We don’t really view them as competing approaches. They’re different tools designed to answer different questions.
Looking Ahead
As we move through the latter part of the third quarter, buyer demand remains healthy, transaction activity continues at a solid pace, and servicing continues to be viewed as an attractive asset class.
What we’ll be watching over the next several months isn’t simply whether Agency servicing moves another 10 or 15 basis points. We’ll also be watching whether buyers continue to differentiate themselves through increasingly portfolio-specific underwriting.
That’s really a theme running throughout much of what we’re seeing today. Rates matter, but so do borrower characteristics. The market multiple matters, but so does the collateral behind it. Overall GNMA delinquency matters, but so does the risk within each delinquency bucket. Float, recapture, credit and servicing costs can all cause two otherwise similar portfolios to produce very different values.
If that trend continues, understanding the individual strengths and risks of a servicing portfolio may become just as important as understanding where the overall market is trading.
As always, if there are topics you’d like us to address in a future Market Update, please don’t hesitate to let us know. Many of the questions we discuss each month come directly from conversations with our clients and friends throughout the servicing industry.
Why MIAC?
For more than three decades, MIAC has provided MSR valuation, analytics and brokerage services across virtually every segment of the servicing market. Our valuation platform supports the analysis of more than $50 trillion of residential and commercial MSRs annually, providing clients with independent fair value opinions, portfolio analytics and market intelligence.
What differentiates MIAC is the combination of analytics and active market participation. As both a valuation provider and an active MSR brokerage firm, we have direct visibility into buyer demand, pricing, transaction structures and actual market execution. That perspective helps us bridge the gap between modeled value and what the market is willing to pay.
At its core, MSR valuation and brokerage require credibility, market insight and execution. MIAC brings all three together.