
By Mike Carnes, Managing Director, MSR Valuations Group, with a GNMA Delinquency Update from Ian Richards, SVP, Borrower Analytics Group
Interest Rates: The Conversation Is Changing Again
For much of the past year, the rate conversation centered around when the Fed would cut and how quickly mortgage rates might follow. That conversation has changed again.
In September, the Federal Reserve raised the federal funds rate by 25 basis points to 3.75%–4.00%, its first increase since 2023. With inflation concerns returning and Treasury yields moving higher, the market is once again having to consider the possibility that rates could stay higher for longer.

Mortgage rates remain near the higher end of their recent range. Treasury yields have also moved sharply higher, with the 10-year Treasury moving above 5% in September as higher oil prices and renewed inflation concerns pushed yields higher.
From a prepayment standpoint, higher mortgage rates continue to provide substantial protection for much of the existing mortgage universe. Borrowers with 3%, 4% and even many 5% mortgages remain well out of the money from a traditional rate-and-term refinance perspective. That continues to support MSR duration.
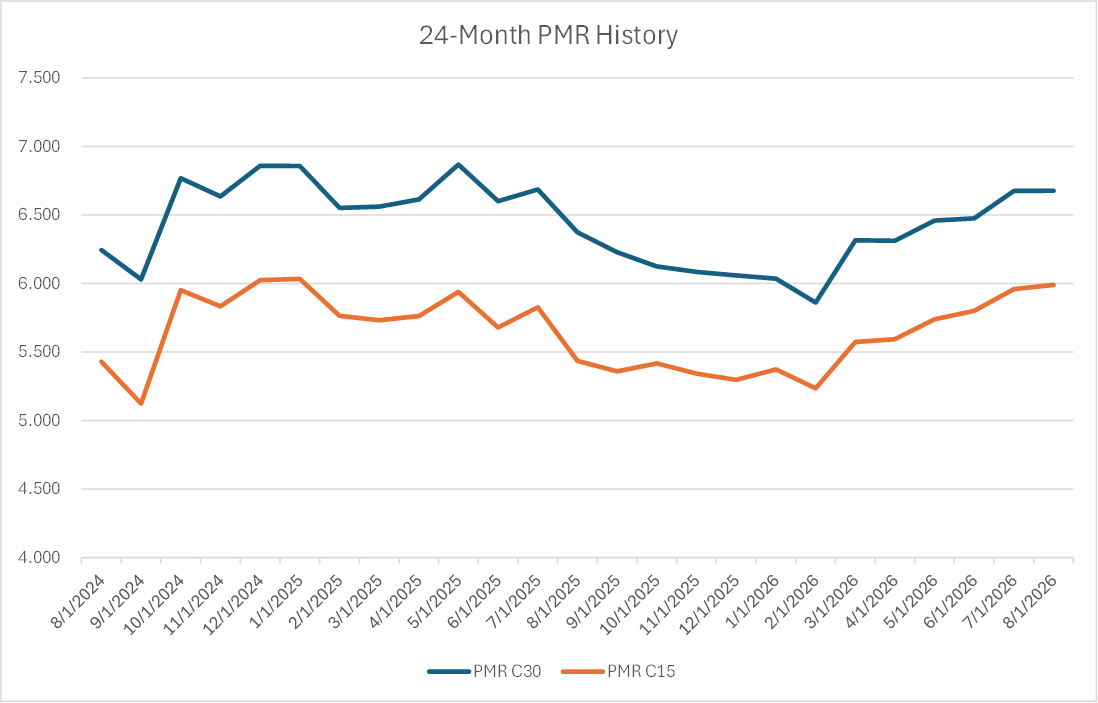
Higher rates can support MSR values in a couple of ways. Higher mortgage rates generally mean slower prepayments, while higher short-term rates can increase earnings on escrow and other float balances. The recent Fed increase provides some additional support to the float side of the equation.
But higher rates aren’t positive in every respect. Affordability remains challenging, housing turnover remains relatively low, and if rates stay elevated long enough, higher borrowing costs can eventually begin to show up in borrower credit performance.
There is also an important distinction between short- and long-term rates, which makes the shape of the curve increasingly important. The Fed has a much more direct impact on short-term rates, while mortgage rates are driven more by longer-term Treasury yields, mortgage spreads and broader market conditions. A Fed move doesn’t necessarily translate into an equivalent move in mortgage rates.
As we discussed last month, a lower-WAC MSR isn’t necessarily going to respond to a change in rates the same way as a higher-WAC portfolio. For a borrower with a 3% or 4% mortgage, even a fairly significant decline in rates may do very little. For a borrower in the 6% to 7% range, a much smaller move can change the refinance economics considerably.
GSA Retrospective Analysis – Month-End Update
MIAC’s latest GSA Retrospective Analysis reflected a relatively small 0.21-basis-point increase in overall MSR values, with the aggregate value increasing from 145.33 bps to 145.54 bps.
MIAC’s Retrospective Analysis is designed to explain not only how much an MSR portfolio changed in value, but why it changed. The analysis can be performed daily, weekly or monthly and breaks the change in value into the following components:

While the overall change was small, there was considerably more movement among the individual components. The projected parallel movement in rates contributed 0.62 bps to value, while time added another 0.32 bps. Those gains were largely offset by SS basis movement, which reduced value by 0.57 bps, and non-parallel curve movement, which reduced value by another 0.20 bps. OAS added a modest 0.03 bps, while PS basis, volatility and assumption changes had essentially no impact.
As was the case last month, changes to MIAC’s modeling assumptions had essentially no impact on the results.
Product Performance Analysis
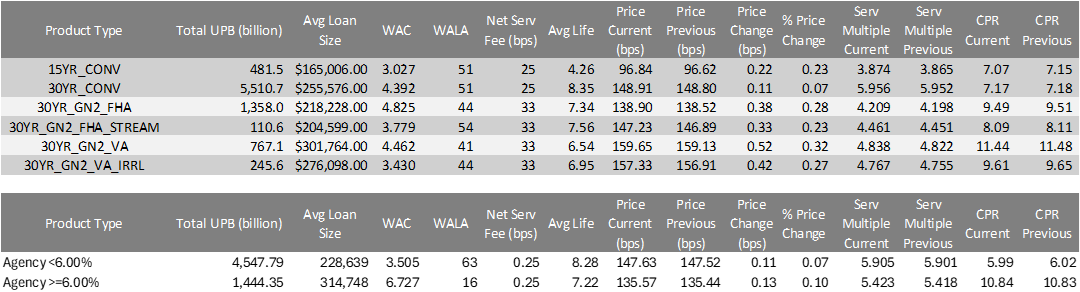
Performance across the individual products was relatively quiet. All of the major cohorts increased in value, but the changes were considerably smaller than what we saw last month.
The strongest performer was 30-year GNMA VA servicing, which increased 0.52 bps to 159.65 bps, while its servicing multiple increased from 4.822x to 4.838x. Projected CPR was essentially unchanged, declining slightly from 11.48% to 11.44%.
GNMA FHA increased 0.38 bps, while FHA Streamline increased 0.33 bps and VA IRRRL increased 0.42 bps. Projected prepayments were largely unchanged across each of these products.
Conventional MSRs experienced even smaller changes. Conventional 30-year increased just 0.11 bps, with the servicing multiple moving from 5.952x to 5.956x. CPR was essentially unchanged at 7.17%. Conventional 15-year increased 0.22 bps, while CPR declined slightly from 7.15% to 7.07%.
CPR projections changed very little across the GSA cohorts. Instead, several market factors moved in opposite directions and left overall MSR values relatively unchanged.
The WAC cohorts showed relatively little movement as well. Agency MSRs with WACs below 6.00% increased 0.11 bps, while Agency MSRs with WACs of 6.00% or greater increased 0.13 bps. CPR was also virtually unchanged for both populations.
|
5.99%
Agency WAC below 6.00%
|
10.84%
Agency WAC of 6.00% or greater
|
The difference in refinance exposure between the two populations remains significant. Projected CPR for the higher-WAC cohort was 10.84% compared with 5.99% for the lower-WAC cohort. This gets back to the point made earlier in this Update. The prevailing mortgage rate matters, but where the borrower sits relative to that rate matters just as much.
The retrospective analysis also helps show why looking only at the beginning and ending MSR value doesn’t always tell the full story. The overall value increased only 0.21 bps, but there was considerably more movement among the individual factors that contributed to that result.
For institutions actively managing or hedging MSR exposure, that distinction can be important. MIAC’s Retrospective Analysis separates market-driven performance from assumption changes and provides a clearer picture of the factors contributing to the change in value.
MSR Supply Is Starting to Change Buyer Behavior
One of the more interesting things we’re seeing in the bulk market today isn’t necessarily a change in demand. It’s a change in supply.
Demand for quality Agency servicing remains strong, particularly for lower-WAC conventional portfolios. The challenge is that there simply isn’t an unlimited amount of that collateral available for sale. As that supply becomes more difficult to find, we’re beginning to see some buyers broaden their investment criteria.
That doesn’t mean buyers are becoming less disciplined. A higher-WAC portfolio still carries more refinance exposure. A GNMA portfolio requires considerably different credit and servicing analysis than a conventional portfolio. Geography, average loan balance, delinquency, servicing cost and recapture all continue to matter.
What is changing is the willingness of some buyers to evaluate risks that might previously have caused them to pass. For a buyer with capital to deploy, the question becomes whether the additional return adequately compensates them for taking that risk.
We expect that to become increasingly important as we move through the remainder of the year.
Higher-WAC MSRs: Risk to One Buyer, Opportunity to Another
Higher-WAC servicing provides a good example of why MSR pricing can vary so much between buyers.
As a borrower’s note rate gets closer to the prevailing mortgage rate, refinance incentive increases. Expected prepayments rise, the expected life of the servicing asset becomes shorter and MSR value generally declines.
For a buyer with a strong origination and recapture platform, however, a prepayment doesn’t always mean the complete loss of the customer relationship. If the borrower can be retained and refinanced back onto the buyer’s platform, the economics can look considerably different.
We’ve seen recapture assumptions add meaningful value to certain higher-WAC portfolios. As we discussed last month, depending on the collateral and buyer, we’ve seen recapture contribute as much as 0.75x to 1.00x to the servicing multiple.
That doesn’t mean every buyer should assign that value. Recapture performance can vary considerably depending on origination channel, geography, borrower characteristics and the strength of the buyer’s origination platform.
That’s one reason we continue to see fairly wide bid dispersion on some higher-WAC portfolios.
Two buyers can look at exactly the same loans, make reasonable assumptions and arrive at very different prices because the economics of owning those MSRs aren’t necessarily the same for each buyer.
GNMA: Market Value Versus Servicer Economics
One of the more interesting valuation questions in the GNMA market today is how much value should be assigned to the economics associated with loss mitigation.
The largest GNMA servicers have developed highly specialized operations around delinquent borrowers. Modification incentives, EBO activity, servicing efficiencies and the ability to eventually redeliver certain reperforming loans can create meaningful economics for those firms.
This distinction becomes particularly important with seriously delinquent MSRs. We’ve seen transactions where even sophisticated GNMA servicers place little or no positive value on seriously delinquent servicing. In some cases, the economics actually move in the opposite direction, with the seller effectively paying the buyer to assume certain 90+ day delinquent MSRs.
What an MSR is worth to a highly specialized servicer isn’t necessarily the same as what the MSR is worth in the broader market.
A specialized GNMA servicer may be able to cure and modify borrowers more efficiently, generate incentive income, finance EBOs more efficiently and potentially realize additional economics through redelivery. Those capabilities can make the asset considerably more valuable to that particular servicer.
But most GNMA servicers don’t have the same scale, operating capabilities or economics. Even the firms that do may still require significant compensation to assume seriously delinquent servicing.
That makes it difficult to simply capitalize the economics of modification, EBO and redelivery into the value of the underlying MSR. The buyer may ultimately generate substantial revenue from the borrower, but that’s different from saying the servicing right itself had positive market value when it transferred.
Where the Lines Get Blurry
The universe of active GNMA MSR buyers is relatively concentrated, particularly for portfolios containing meaningful delinquency. If the buyers most capable of executing these transactions are also the firms with the most sophisticated loss-mitigation operations, their economics will naturally influence observable market pricing.
That’s where the distinction between market value and buyer-specific economic value becomes more difficult.
When the market consists largely of specialized buyers, their economics become part of the market. But that doesn’t necessarily mean every element of their economics should be reflected in fair value.
For valuation purposes, we think that distinction is important. The question isn’t simply what the best GNMA servicer can ultimately earn from a delinquent borrower. The question is what a market participant would pay for the servicing right while assuming the associated servicing obligations, advancing requirements and credit-related costs.
Observable transaction behavior remains an important part of answering that question. When the market requires the seller to compensate the buyer for taking certain seriously delinquent MSRs, that is difficult market evidence to ignore.
GNMA Delinquency Update – GNMA Extended Term Pools
|
$54.5B
Issued in Extended Term pools
|
$36.2B
Issued in the last 18 months
|
$10.3B
Issued since May
|
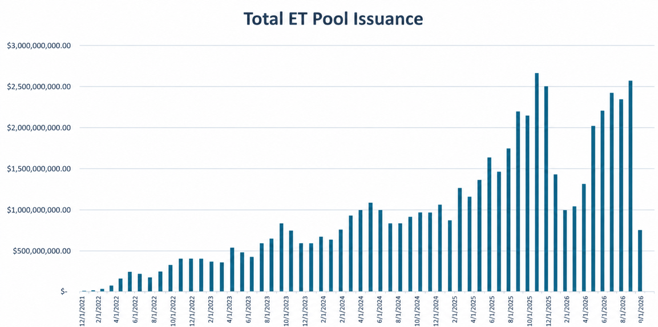
There has been an explosion in GNMA extended term (ET) pool issuance in recent months. Of the $54.5B ever issued in Extended Term pools, $36.2B has been issued in the last 18 months. Of the $36B active in these pools today, $10.3B was issued since May!
Extended term pools are typically the end of the GNMA credit waterfall. The credit quality issues in post-pandemic vintage GNMA loans are a topic we have mentioned quite frequently. Those elevated delinquency and modification levels have led down the waterfall into this eruption of ET issuance at the end of the line. Borrowers end up in these pools due to multiple modifications and loss mitigations that do not lead to consistent reperformance, so credit performance is normally quite poor.
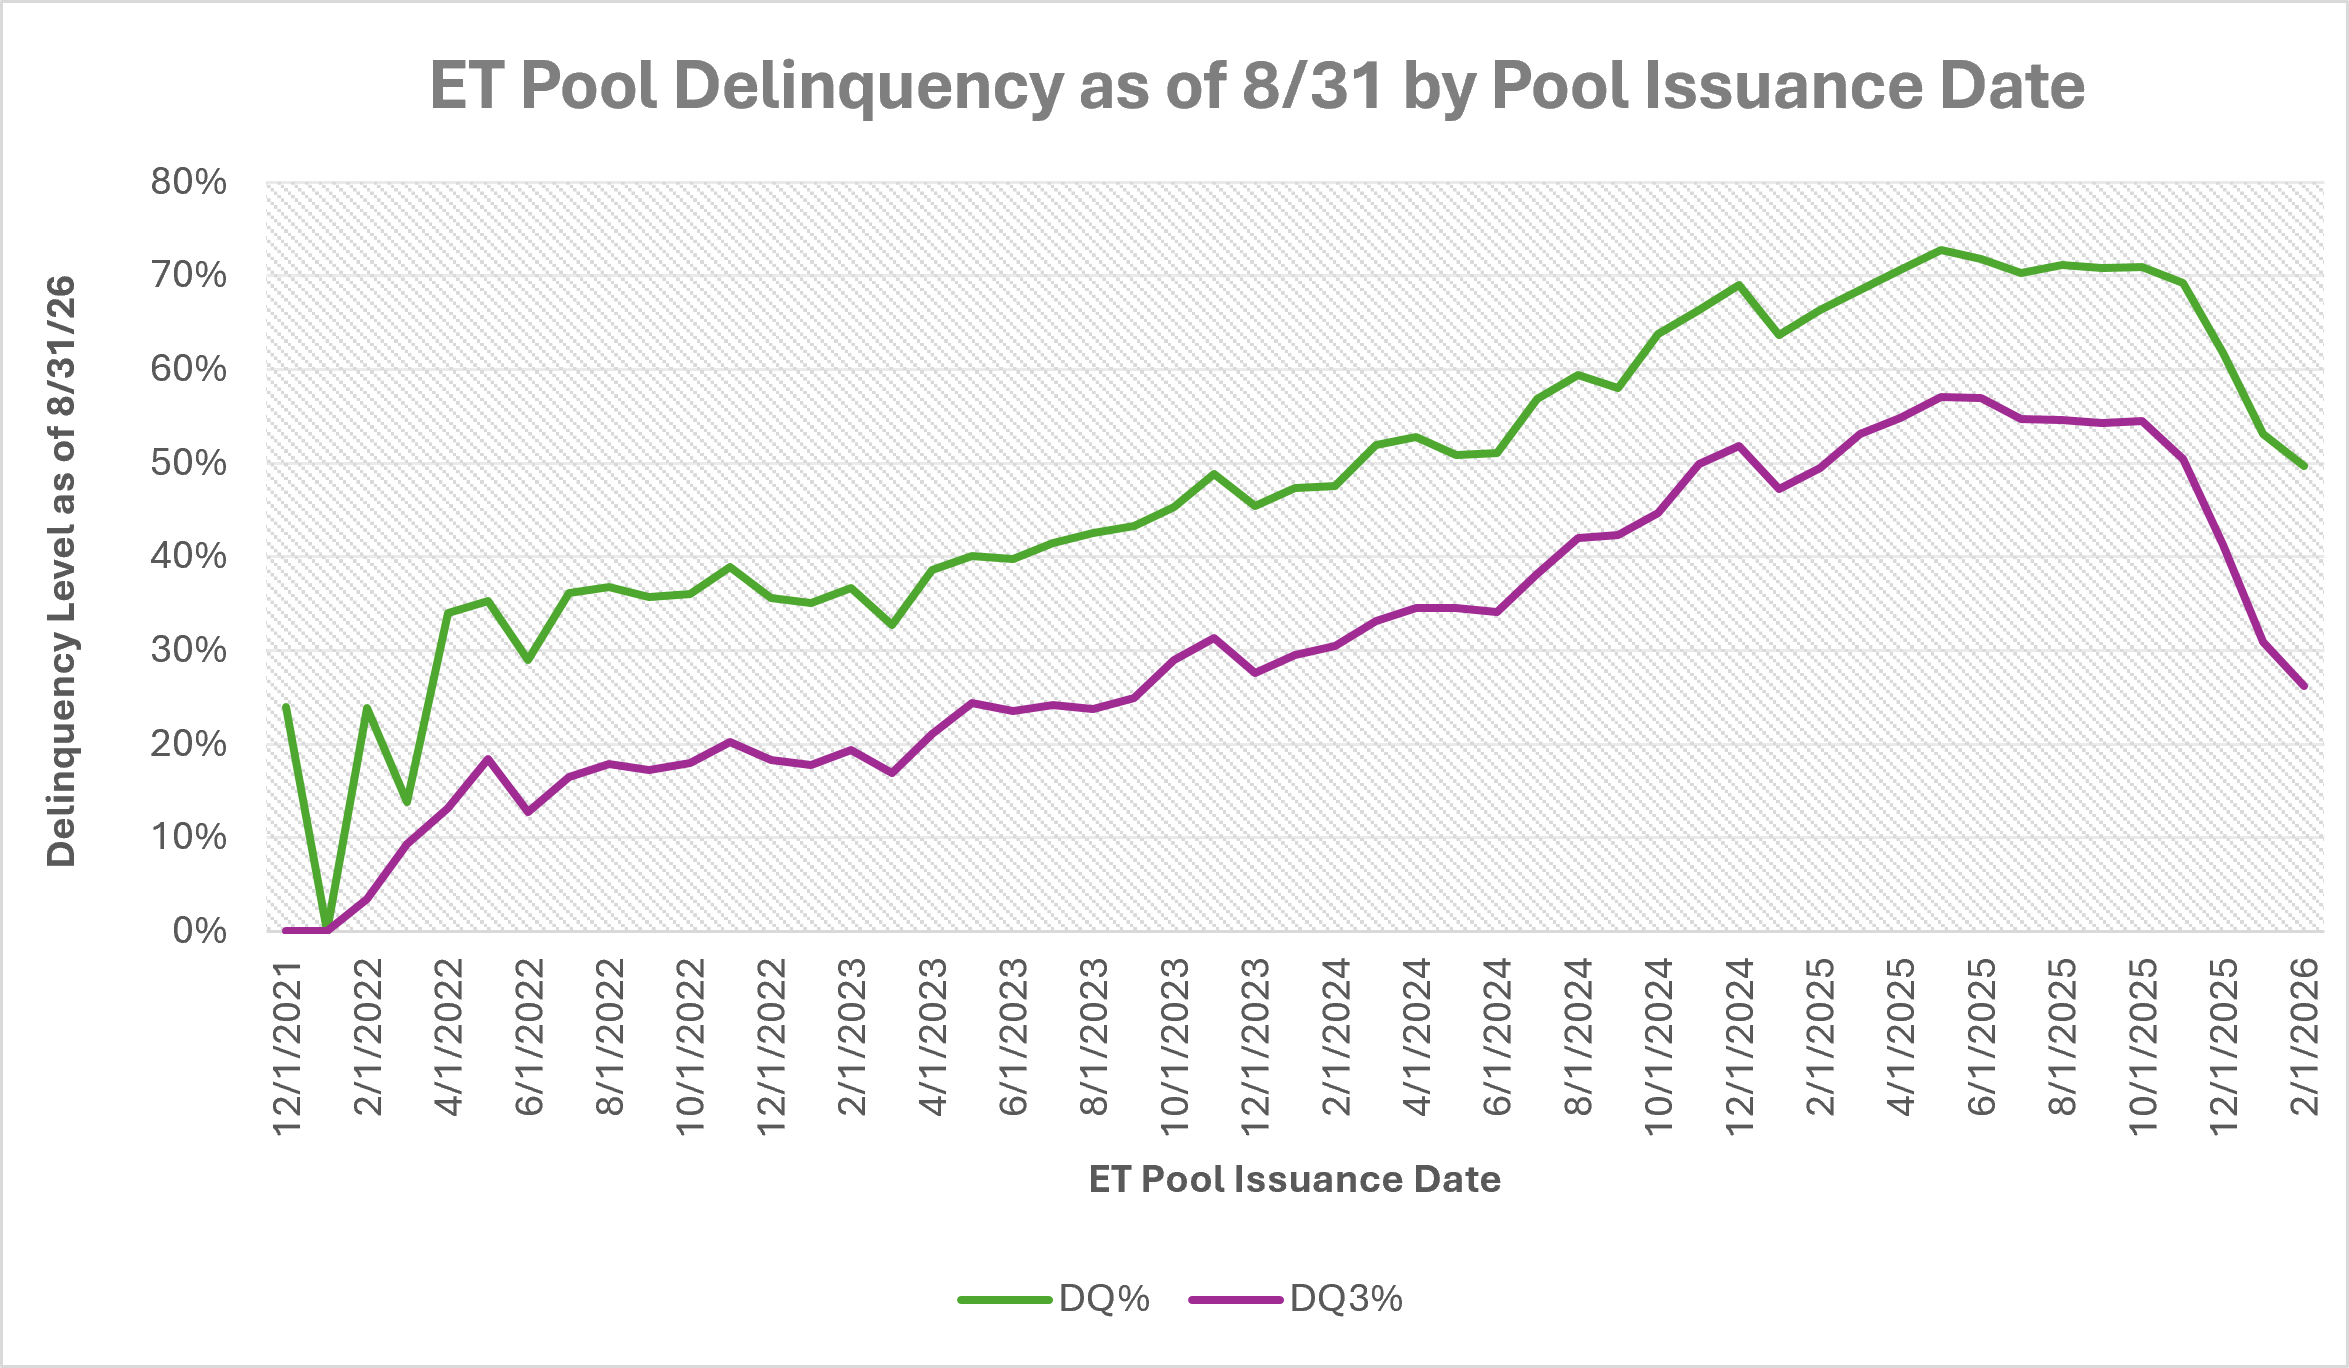
However, while ET pools typically have poor credit, the delinquency level in much of the recent issuance is mind boggling. While ET pools typically have overall delinquency levels around 40%, the 2024 Q4 – 2025 Q4 pools have 60-70% total delinquency and 40-50% D90+ rates. The delinquencies are increasing so rapidly, and the failure rate is so soon after issuance, these pools have been attracting investors that look for short duration products despite the complete lack of voluntary prepayments.
For more information on ET Pools, see our latest write-up on GNMA ET Pools here, or reach out to your sales representative.
Bulk MSR Market Update
The bulk MSR market remains active as we move through September, with no meaningful change in how deals are executing compared with August.
Quality Agency servicing continues to attract strong buyer interest. Typical Agency portfolios are generally trading in the 5.50x to 6.25x range, with stronger lower-WAC portfolios capable of reaching into the mid-to-upper 6x range depending on the collateral. We still haven’t seen the market broadly break through the 7x level.
Higher-WAC servicing continues to trade at a discount because of the additional prepayment exposure, although the discount can vary considerably by buyer. Recapture capabilities can make a meaningful difference, particularly for buyers with strong origination platforms.
GNMA remains more segmented. Clean, performing GNMA servicing continues to attract interest, while portfolios with meaningful delinquency can have very different economics and a much smaller universe of potential buyers.
Beyond coupon and investor, we continue to see geography, average loan balance, credit, delinquency, origination channel and servicing cost influence execution. As a result, two portfolios with similar headline characteristics can still trade at noticeably different levels.
So far, September looks more like a continuation of August than a change in direction. Buyer demand remains healthy and pricing remains relatively stable, but execution continues to depend heavily on the underlying collateral and which buyers are the best fit for it.
Commercial MSRs: A Different Kind of Servicing Asset
We spend most of our time in these updates discussing residential MSRs, but commercial and multifamily servicing deserves some attention as well.
Commercial mortgage activity has been improving. According to the Mortgage Bankers Association, commercial and multifamily mortgage originations increased 16% in the second quarter compared with a year earlier and 12% from the first quarter.
|
+8%
Multifamily originations YoY
|
+47%
Office originations YoY
|
+68%
CMBS originations YoY
|
Multifamily originations increased 8% year over year and 15% from the prior quarter. Office originations increased 47% from a year earlier, while healthcare was one of the exceptions, declining 19%. By investor type, CMBS originations increased 68% year over year.
Increasing origination activity ultimately means more commercial servicing, but commercial mortgage servicing rights can behave quite differently from residential MSRs.
The most obvious difference is prepayment. Residential mortgage prepayment is heavily influenced by borrower refinance incentive. Commercial loans are much more likely to have contractual prepayment provisions such as yield maintenance, defeasance, lockout periods or other restrictions. That can materially change the duration profile of the servicing asset.
Float can also represent a significant portion of commercial MSR value. Large principal and interest balances, tax and insurance escrows and other reserve accounts can generate substantial float balances. Depending on remittance requirements and the terms governing those accounts, earnings on those balances can represent a meaningful portion of total servicing value.
That creates an interesting relationship with interest rates. A commercial servicing portfolio with relatively strong prepayment protection may have considerably less refinance optionality than a residential portfolio. At the same time, its value may still be quite sensitive to changes in the earnings rate assumed on float balances.
There are also concentration considerations. A residential portfolio may contain tens or hundreds of thousands of loans, while a commercial portfolio can have a meaningful percentage of its total value concentrated in a relatively small number of loans. One large payoff can therefore have a noticeable impact on servicing value.
That’s why commercial MSR valuation generally requires looking closely at the individual loan terms, prepayment provisions, remaining maturity, servicing fee, float balances and remittance structure.
The same basic discounted cash-flow principles apply, but the underlying economics can be very different.
MIMs: What the Market Is Expecting From Prepayments
Prepayment assumptions remain one of the most important drivers of MSR value, but there can be a meaningful difference between what a model projects and what the broader market expects.
MIAC’s Mortgage Industry Medians™ (MIMs) provides another way to look at that question. MIMs is a semi-monthly survey of dealer prepayment expectations across a broad range of mortgage products and coupons. The survey provides both base-case prepayment expectations and projections under different interest-rate scenarios.
What makes MIMs particularly useful for MSR holders is that it provides an independent market benchmark against which their own prepayment assumptions can be compared. If a portfolio is being valued using speeds that are materially faster or slower than the dealer consensus, that doesn’t necessarily mean the assumptions are wrong, but it does raise a question worth exploring.
That becomes particularly important in the current rate environment. As we’ve discussed throughout this Update, borrowers with lower note rates remain well out of the money, while borrowers with higher note rates will respond much more quickly to relatively small changes in mortgage rates.
MIMs provides another way to measure that difference and, more importantly, how the market expects borrower behavior to change as rates move. Below you can see a month-over-month comparison from mid-August to mid-September Conventional 30 speeds across multiple dealer models, and show how the speed expectations shifted with rates across a selection of cohorts:

To access the full MIMs report across the entire market, with rate shocks and multiple product types included, please reach out to your MIAC sales representative or go to miacanalytics.com.
Looking Ahead
As we move toward the end of the third quarter, the MSR market remains healthy, but it is also changing.
Lower-WAC conventional supply is becoming more difficult to find, and some buyers are broadening their investment criteria as a result. Higher-WAC servicing is putting greater emphasis on recapture, while GNMA continues to highlight the difference between market value and servicer-specific economics.
At the same time, the interest-rate outlook has become considerably less predictable.
For valuation purposes, it also reinforces something we’ve discussed throughout the year. Market value and economic value can be very different things, and understanding the difference is becoming increasingly important.
As always, if there are topics you’d like us to address in a future Market Update, please don’t hesitate to let us know. Many of the questions we discuss each month come directly from conversations with our clients and friends throughout the servicing industry.