
MIAC is pleased to introduce the GNMA Performance Tracker. These reports and related commentary are designed to meet the needs of market participants across the mortgage industry.
We will be updating these reports on a periodic basis. We also expect to enhance and enrich the reports based on feedback from our clients and the broader mortgage community.
Issuer-Type Analysis
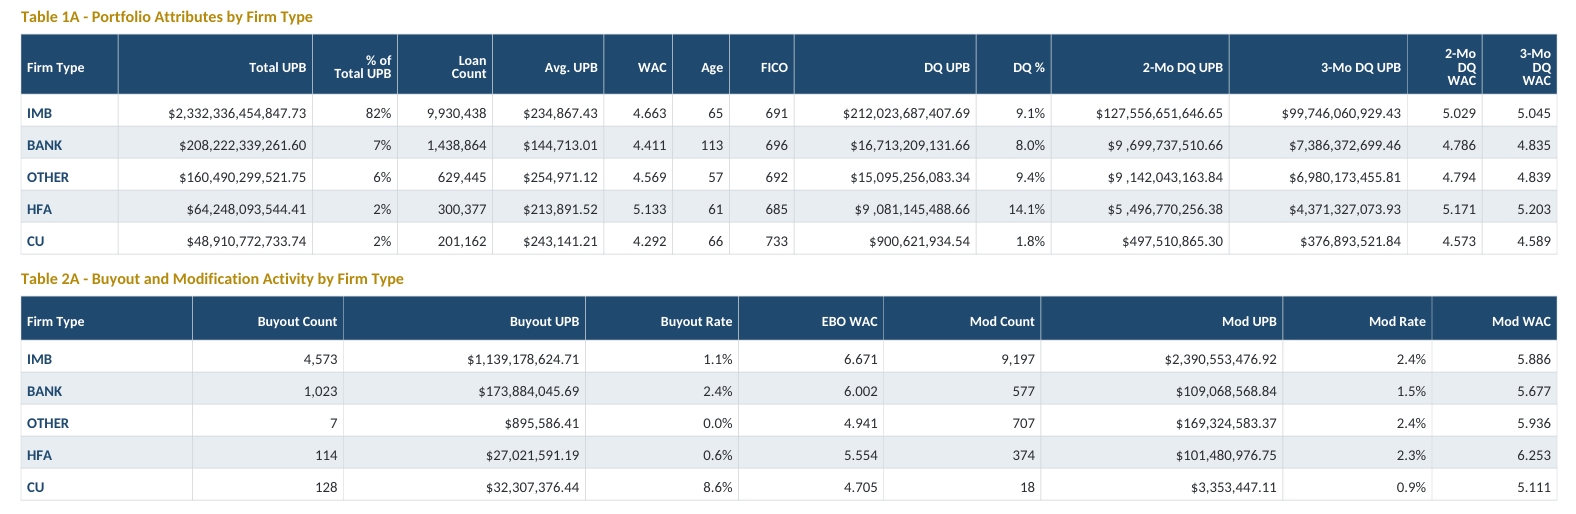
In Tables 1A, 2A, and 3A, we display attributes, buyout and modification levels, and the government agency breakdown by type of firm. These include IMBs (Independent mortgage banks), Banks, CU (Credit Unions and CUSOs), HFAs (Housing Finance Authorities), and OTHER (which includes REITS, CDFIs, and Homebuilder affiliates).

Several observations merit consideration
- IMBs dominate the GNMA market with an 82% market share, balanced evenly between FHA and VA. As is true for all firm categories, the FHA DQs are much higher than VA DQs. As we have made clear in our analytics and research, FHA and VA loans display such disparate credit and prepay behaviors that fully separate models are required.
- The BANK share of GNMAs is low and declining. They have a strikingly small number of outstanding VA loans – the overall total balance of VA is close to that of credit unions. Given their pullback in the FHA space, their outstanding portfolio is very seasoned (age 113) and the average UPB is low (144k).
- As expected, HFAs have the highest levels of delinquency across all government loan sub-sectors (FHA, VA, RHS, PIH). Their weaker performance is not driven primarily by FICO but by other credit drivers, including DPA and LTV. Their targeting of first-time home buyers results in a somewhat lower average balance relative to other issuer categories.
- Credit unions have very low delinquencies in both FHA and VA relative to all other issuer types. This is due in part to their higher credit scores, but our research shows that CUs often outperform their underwriting attributes. This necessitates issuer-specific credit (and prepay analysis). Their issuer tilt toward VA means their blended DQs are exceptionally low. CUs are minor participants in the GNMA sector overall (at 2%).
- Banks and credit unions tend to buy out (EBO) their delinquent mortgages, while IMBs and HFAs tend to modify their delinquent loans. Credit unions have the highest EBO rate among all issuer types.
- All issuer types – except for CUs – now have FHA Delinquency levels above 10%. FHA DQ rates among IMBs now exceed 12%. Details regarding FHA delinquencies and their explanatory drivers are contained in our recent publications.
State-Level Analysis – Top 20 States by GNMA Balance
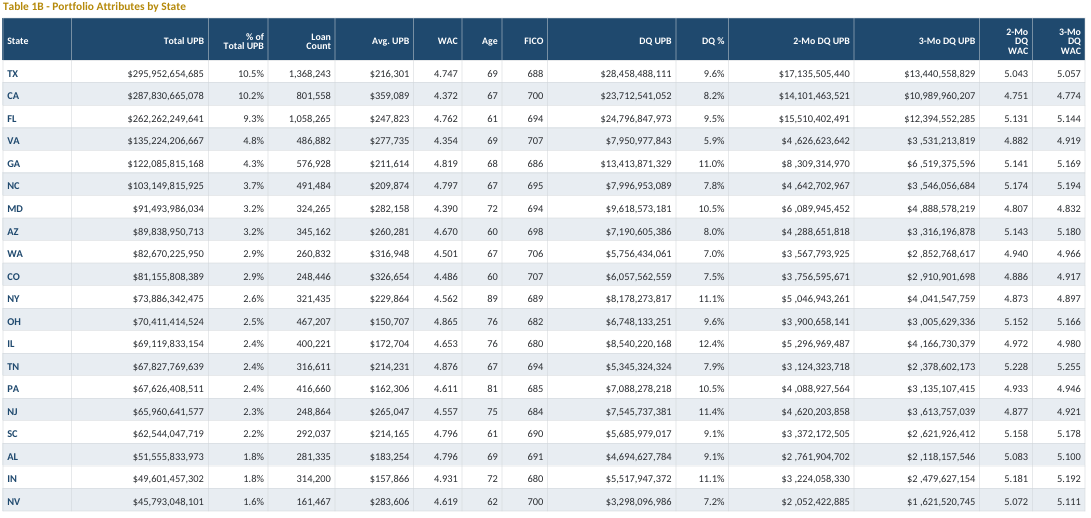
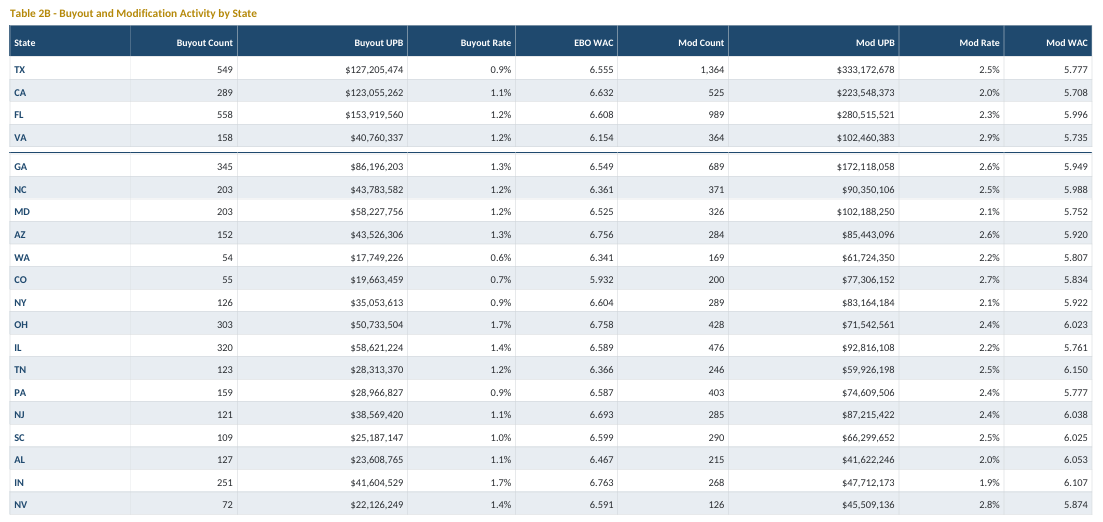
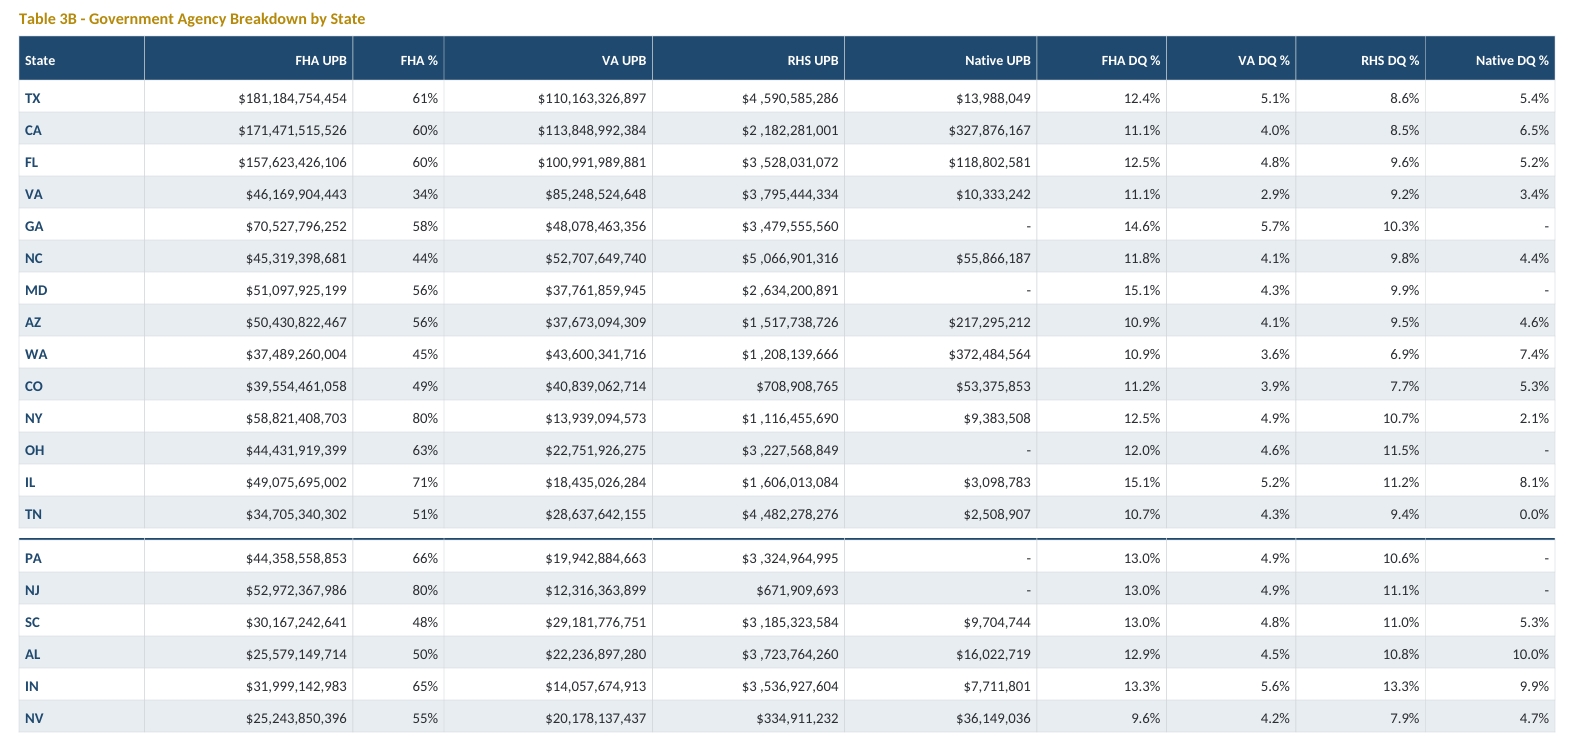
Tables 1B, 2B, and 3B display attributes, buyout and modification levels, and the government agency breakdown for each the top 20 states by GNMA loan balance.
A few noteworthy observations:
- Delinquency rates vary a lot across states, in part due to the FHA/VA mix of that state.
- The states with the highest rate of FHA delinquencies are Illinois and Maryland, at 15.1% delinquency, closely followed by Georgia at 14.6% DQ.
- Virginia’s enormous VA balance has pushed them to the 4th largest state in terms of overall GNMA outstanding balance. Market participants have long acknowledged the importance of distinguishing FHA v. VA as well as state-level factors in prepayment analysis in SPEC pool pricing. Given the size of the Virgina VA sector, we think it’s time to account for Virginia specific borrower behavior in addition to the “big three” states of TX/CA/FL.
- The FHA/VA mix is a big driver of overall delinquencies. For example, NY and NJ now share the highest FHA concentrations of any state. 80% of GNMA loans in both states are FHA. This leads to very high overall GNMA delinquency levels within those states, despite relatively average delinquency levels in each sector. Thus, while New Jersey is 4th highest in overall GNMA delinquency, it has a fairly standard level of delinquency in their FHA population. Their overall delinquency level is driven by the concentration of FHA loans, not actual worse performance.
Summary
There are many more observations that we could make. We believe that market participants will find these reports useful and we welcome any comments or suggestions. These reports can be customized with additional fields and much higher level of granularity (e.g., at the firm level).
All inquiries should be sent to: DataProducts@MIACAnalytics.com